
?
Target-Date Strategy Landscape: 2023
Executive Summary
Target-date investors largely stayed the course in 2022 despite the extreme market turbulence,
highlighting how important these strategies have become to retirement savers. In this report, we look at
the most popular target-date series in 2022, the ongoing adoption of collective investment trusts as the
preferred vehicle for target dates, and the continued critical role fees play in selecting a series. The
report also examines how target-date strategies navigated 2022’s challenging market environment and
shines a spotlight on the evolving legal battles plan sponsors face over fees, performance, and
environmental, social, and governance risks.
Key Takeaways
× Target-date strategies raked in $153 billion in net assets in 2022; collective investment trusts led the
way, absorbing $121 billion—or 79%—of the year’s net inflows.
× CITs make up 47% of target-date strategy assets as of the end of 2022 and are projected to become the
most popular target-date vehicle within the next two years.
× Plan sponsors continue to display a strong preference for lower-cost target-date strategies, exhibited by
both inflows to lower-cost mutual fund series and the growing popularity of CITs.
× Industry titan Vanguard Target Retirement earned the top spot for total flows when accounting for both
mutual fund and CIT flows; CITs accounted for about 82% of Vanguard’s flows. At the end of 2022, 51%
of Vanguard’s target-date assets were in its CIT version, marking the first time it surpassed the mutual
fund version in assets.
× American Funds Target Date Retirement garnered the most flows for target-date mutual funds. Its
popularity is driven by its strong long-term performance and competitive fees even as other active-
based target-date strategies have struggled to gain assets due to higher fees.
× Despite target-date strategies’ broad diversification, they experienced losses across the glide path as
typical defensive assets, such as investment-grade bonds and Treasury Inflation-Protected Securities,
suffered losses, along with stocks, as persistent inflation stoked aggressive interest-rate hikes in the
United States.
× Plan sponsors, already under fire due to lawsuits about excessive fees, faced litigation from a new front
in 2022: performance.
× ESG target-date strategies have garnered more attention as the Department of Labor altered its
guidance to allow ESG-focused strategies to serve as a qualified default investment option.
Morningstar
Manager Research
28 March 2023
C
ontents
2
Assets, Flows, and Competitive
Landscape
1
6 Morningstar's Top Target-Date
Strategies
19
2022: The Year (Almost) Nothing Worked
29
Target-Date Legal Battles
Megan Pacholok
Senior Analyst, Multi
-Asset Manager
Research
+1 312 244
-7708
megan.pacholok@morningstar.com
Karen Zaya
, PhD
Anal
yst, Multi-Asset manager Research
+1 312 244 7350
karen.zaya@morningstar.com
Contributors
Adam Millson
Greg Carlson
Hyunmin Kim
Nour Al Twal
Stephen Margaria
Vedran Beogradlija
Important Disclosure
The conduct of Morningstar’s analysts is governed
by Code of Ethics/Code of Conduct Policy, Personal
Security Trading Policy (or an equivalent of),
and Investment Research Policy. For information
regarding conflicts of interest, please
visit:
http://global.morningstar.com/equitydisclosures
Target-Date Strategy Landscape: 2023 | See Important Disclosures at the end of this report.
Page 2 of 34
Assets, Flows, and Competitive Landscape
Target-date strategies remain the investment vehicle of choice for retirement savers. Despite 2022’s
market turbulence, they garnered $153.3 billion in net flows. But with no place to hide from the stock
and bond market downturns, total target-date assets fell to $2.82 trillion in 2022 from its record high of
$3.27 trillion in 2021. Market depreciation drove the roughly 14% drop.
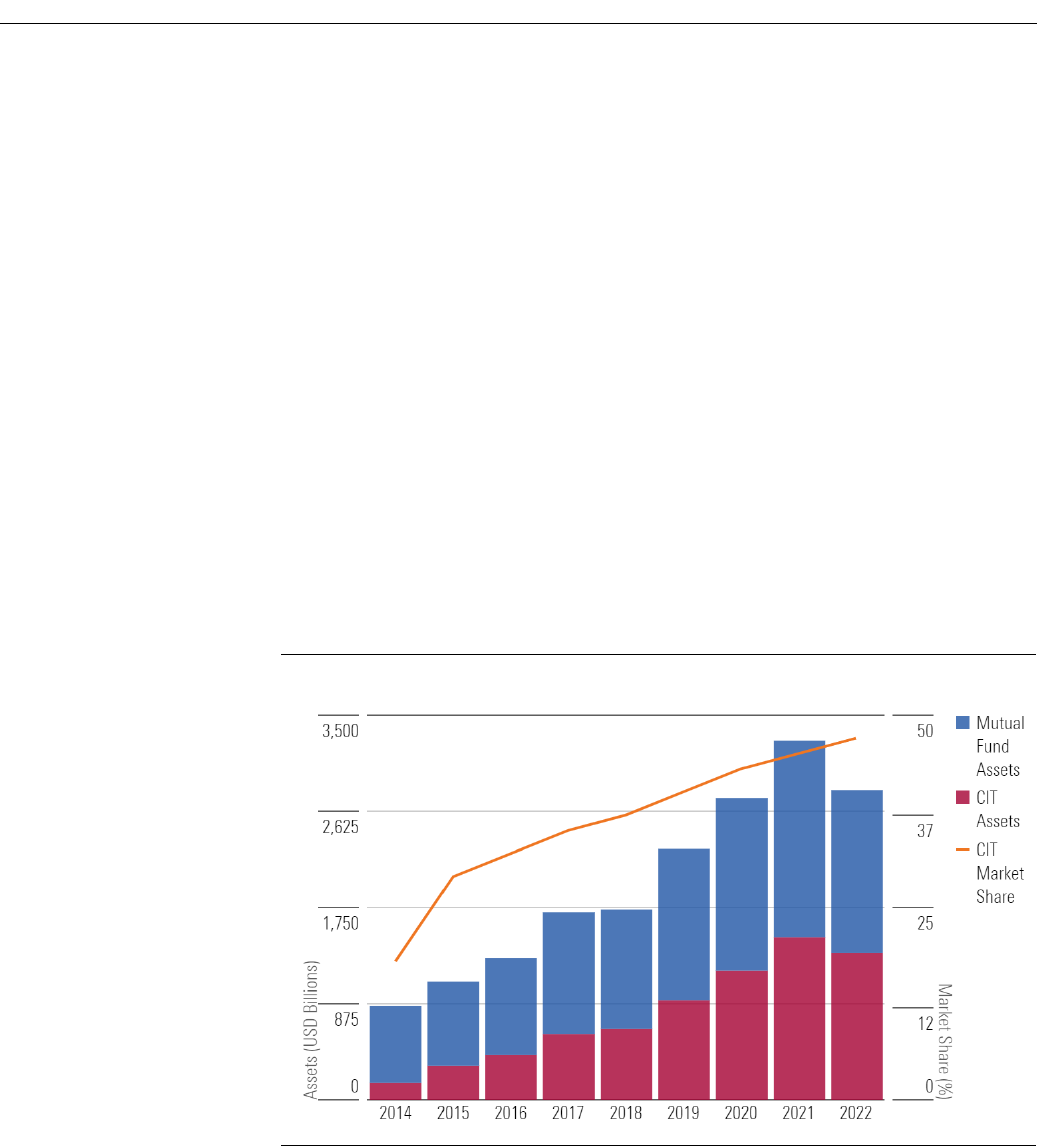
Target-Date CITs Continue to Displace Mutual Funds
Collective investment trusts continue to attract most of the new target-date money. The last decade has
seen a seismic shift, and CITs are becoming the most popular target-date vehicles. CITs now make up
47% of assets in target-date strategies, a 10-percentage-point market share jump in the five years since
2018 and a 2-percentage-point increase since 2021. As plan sponsors convert to CITs from mutual funds
to lower fees, they could overtake target-date mutual fund assets in the coming year. Vanguard Target
Retirement, for example, is the largest target-date strategy by a wide margin, and in 2022, its CIT assets
surpassed its mutual fund assets. Exhibit 1 shows the growth of target-date mutual fund and CIT assets
since 2014.
Exhibit
1 Total Target-Date Assets
Source: Morningstar Direct, author's calculations, and surveyed data. Data as of 12/31/2022.
Target Dates Prove Their Worth
Investors continued contributing to target-date strategies as stocks and bonds suffered double-digit
losses in 2022, showing that retirement savers are using these vehicles as they are intended: as long-
term investments.
In 2022, investors deposited a net $153 billion into target-date strategies. That’s down a bit from 2021’s
$170 billion haul, but much better than the broader universe of mutual funds and ETFs that saw $370
Target-Date Strategy Landscape: 2023 | See Important Disclosures at the end of this report.
Page 3 of 34
billion in net outflows 2022. It was the first year mutual funds and ETFs recorded net outflows since
Morningstar began tracking the data in 1993.
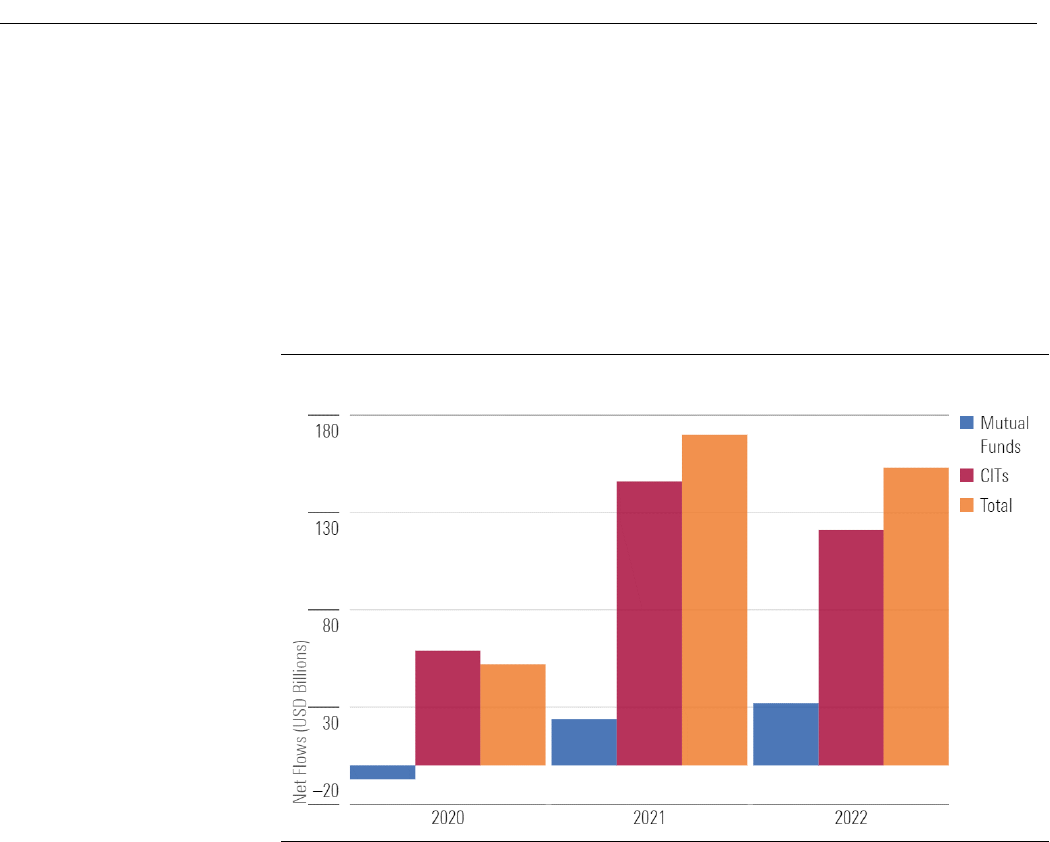
Most of the net new target-date money flowed into CITs, which hauled in $121 billion compared with
mutual fund’s $32.3 billion. CITs are typically cheaper than mutual funds. Exhibit 2 shows the year-over-
year change in net inflows into target-date mutual funds, CITs, and overall.
Exhibit 2
Year-Over-Year Change in Target-Date Net Flows
Source: Morningstar Direct
and surveyed data. Data as of 12/31/2022.
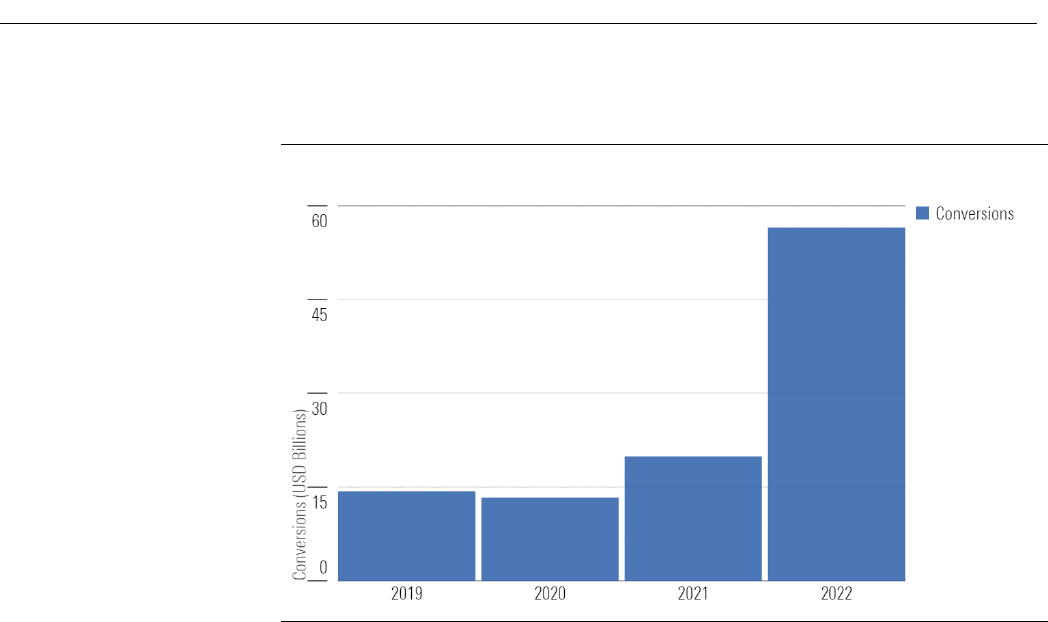
In addition to garnering more new deposits, the conversion of target-date mutual fund assets to CITs has
surged. Based on reported flow data, more than $56 billion in target-date mutual funds converted to
CITs in 2022—nearly triple 2021’s value. Plan sponsors typically stay with the same investment strategy
but switch investment vehicles to lower fees when they convert.
Target-Date Strategy Landscape: 2023 | See Important Disclosures at the end of this report.
Page 4 of 34
Exhibit 3
Mutual Fund to CIT Conversions
Source: Morningstar Direct
and surveyed data. Data as of 12/31/2022.
CITs' lower price tags have increased their popularity. The government regulates them differently. The
Investment Company Act of 1940 governs mutual funds, while Department of Labor’s Employment
Retirement Income Security Act, or ERISA, covers CITs. The key differences are that CITs' investment
managers can negotiate individual fee schedules with clients and don’t have to disclose as much
information as often as mutual funds. That lowers CITs’ overall costs but reduces transparency. For
example, CITs are not required to disclose portfolio manager names and often don’t even regularly
update their performance and holdings like mutual funds do.
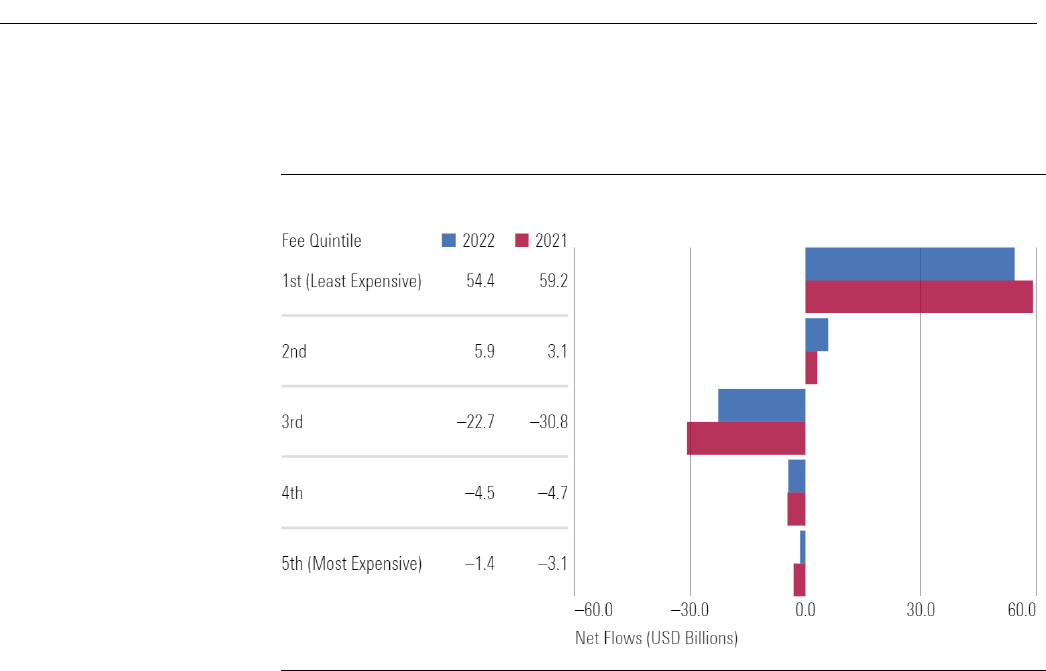
Persistent Preference for Lower Fees
Plan sponsors that choose target dates for defined-contribution plans continue to prefer lower fees.
Assets continue to pour into lower-cost target-date mutual funds and out of costlier offerings. A wave of
excessive-fee lawsuits against plans, which show no sign of cresting, has helped drive the trend. In
2022, for example, there were more than 80 excessive-fee lawsuits filed against 401(k) plans, almost
double the number filed in 2021, according to mutual fund industry news site Ignites. Exhibit 4 illustrates
net flows by fee quintile for target-date mutual funds over the last two calendar years.
Target-Date Strategy Landscape: 2023 | See Important Disclosures at the end of this report.
Page 5 of 34
Exhibit 4
Target-Date Mutual Fund Flows by Fee Quintile
Source: Morningstar Direct and author's calculation. Data as of 12/31/2022. Excludes zero-fee share classes.
In 2022, target-date mutual funds in the cheapest quintile amassed over $54 billion in inflows, a bit less
than the $59 billion it reaped in 2021. Fidelity Freedom Index and Vanguard’s Target Retirement Series,
two of the cheapest series available, took in $14.3 billion and $11.7 billion, respectively. The second-
cheapest quintile tallied almost $6 billion in inflows during the year, up from $3 billion in 2021. The three
most expensive quintiles posted a total of $28.5 billion in outflows for 2022, as investors continued to
prefer lower-cost options.
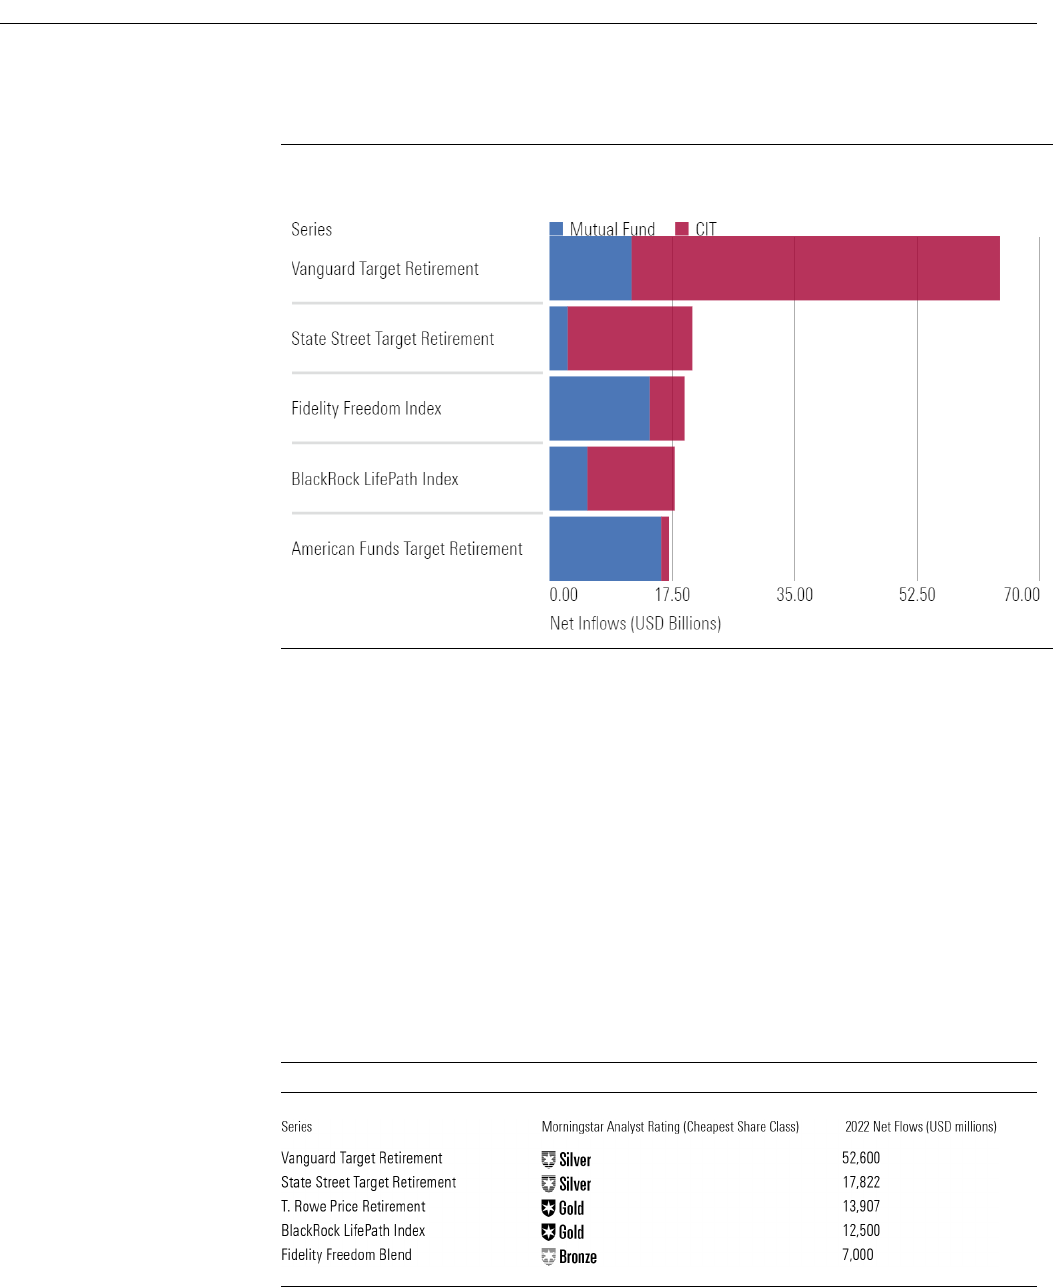
Most Popular Target Dates in 2022
Vanguard Target Retirement amassed the most net inflows in 2022. The series, which has been in the
top spot in all but one calendar year since 2008, took in more than $64 billion, nearly $44 billion more
than the next highest series, State Street Target Retirement. Vanguard’s CIT collected most of the
assets, but its mutual fund version also gathered more flows than competitors. Exhibit 5 shows the top
five series ranked by total net inflows into both mutual funds and CITs.
Target-Date Strategy Landscape: 2023 | See Important Disclosures at the end of this report.
Page 6 of 34
Exhibit 5
Top 5 Series by Net Inflows (Mutual Funds and CITs)
Source: Morningstar Direct, author's calculation, and surveyed data. Data as of 12/31/2022.
State Street Target Retirement, with $20.4 billion in net flows mostly into its CITs, jumped to second
from fifth place the year prior. Fidelity Freedom Index slipped to third from second. BlackRock LifePath
Index's stable net year-over-year inflows locked down fourth place. American Funds Target Retirement,
the only series using actively managed underlying investments in the top five, fell from third to fifth
place. Its competitive price tag and strong performance have helped it buck the trend against active
options.
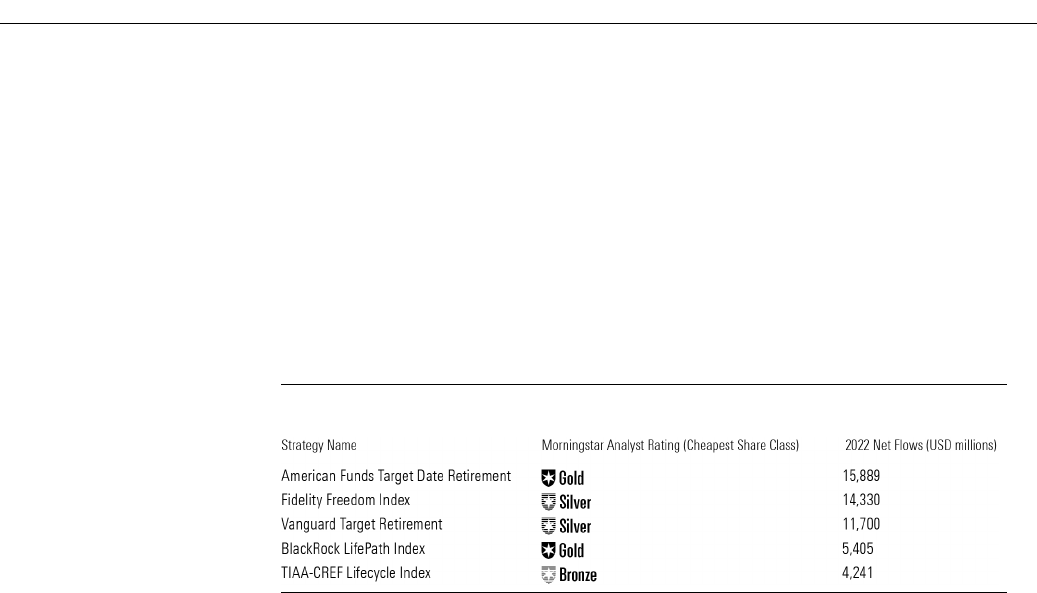
Only Vanguard and BlackRock LifePath Index made the top five for both CITs and mutual fund flows. The
top five series by CIT flows include a mix of index-based, active-based, and blend series, as shown in
Exhibit 6.
Exhibit
6 Top 5 Series by CIT Net Inflows
Source: Morningstar Direct and surveyed data. Data as of 12/31/2022.
Target-Date Strategy Landscape: 2023 | See Important Disclosures at the end of this report.
Page 7 of 34
T. Rowe Price Retirement target-date mutual funds have been in outflows for years; however, its CIT
version rakes in competitive net inflows. Over the past couple of years, the series experienced positive
net flows overall due to its CIT series. Fidelity Freedom Blend’s fifth-place CIT was launched as a CIT in
2007 and later as a mutual fund series in 2018.
The active American Funds Target Date Retirement Series gathered the most target-date mutual fund
flows in 2022, but index-based series continue to dominate flows, as Exhibit 7 shows.
Exhibit
7 Top 5 Series by Mutual Fund Net Inflows
Source: Morningstar Direct. Data as of 12/31/2022.
Below the Fold
Beyond the top five series that tend to dominate asset flows, target-date strategies that mix active and
passive funds continue to see positive inflows. This blend, or hybrid, approach isn’t new but has gained
traction in recent years as investors try to cut costs by indexing in more efficient asset classes and using
active strategies in more inefficient areas where the odds of beating benchmarks are better.
In 2022, four blend series were among the top 10 in target-date mutual fund series net flows: Fidelity
Freedom Blend, John Hancock Lifetime Blend Portfolio, Pimco RealPath Blend and Principal Lifetime
Hybrid. They collected a combined $4.1 billion. Blend strategies also have gained a lot of traction among
CITs. Three blend series snagged spots on the top 10 CIT flow list: Fidelity Freedom Blend, T. Rowe Price
Retirement Blend, and Principal Lifetime Hybrid Target Series, which collectively gathered roughly $12.8
billion in net new asset flows.
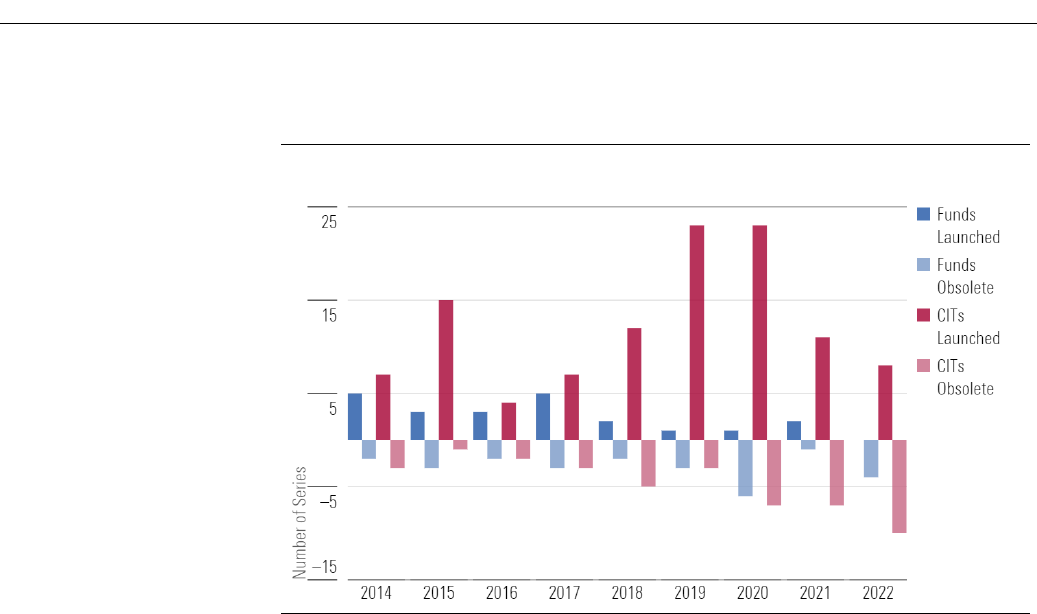
Launches and Closes
The number of target-date options shrunk overall as both CITs and mutual funds experienced more
closures than openings. No new mutual fund series launched in 2022, but there were eight new CITs,
demonstrating asset managers’ optimism for growth in the latter vehicle. Exhibit 8 illustrates target-date
series launches and closures since 2014.
Target-Date Strategy Landscape: 2023 | See Important Disclosures at the end of this report.
Page 8 of 34
Exhibit
8 Target-Date Launches and Terminations, 2014-22
Source: Morningstar Direct. Data as of
12/31/2022.
In 2022, Fidelity launched the CIT version of its Fidelity Freedom target-date series, whose mutual fund
version has been losing assets and has been the target of several excessive fee lawsuits. The CIT version
makes the firm’s active series available at a lower cost.
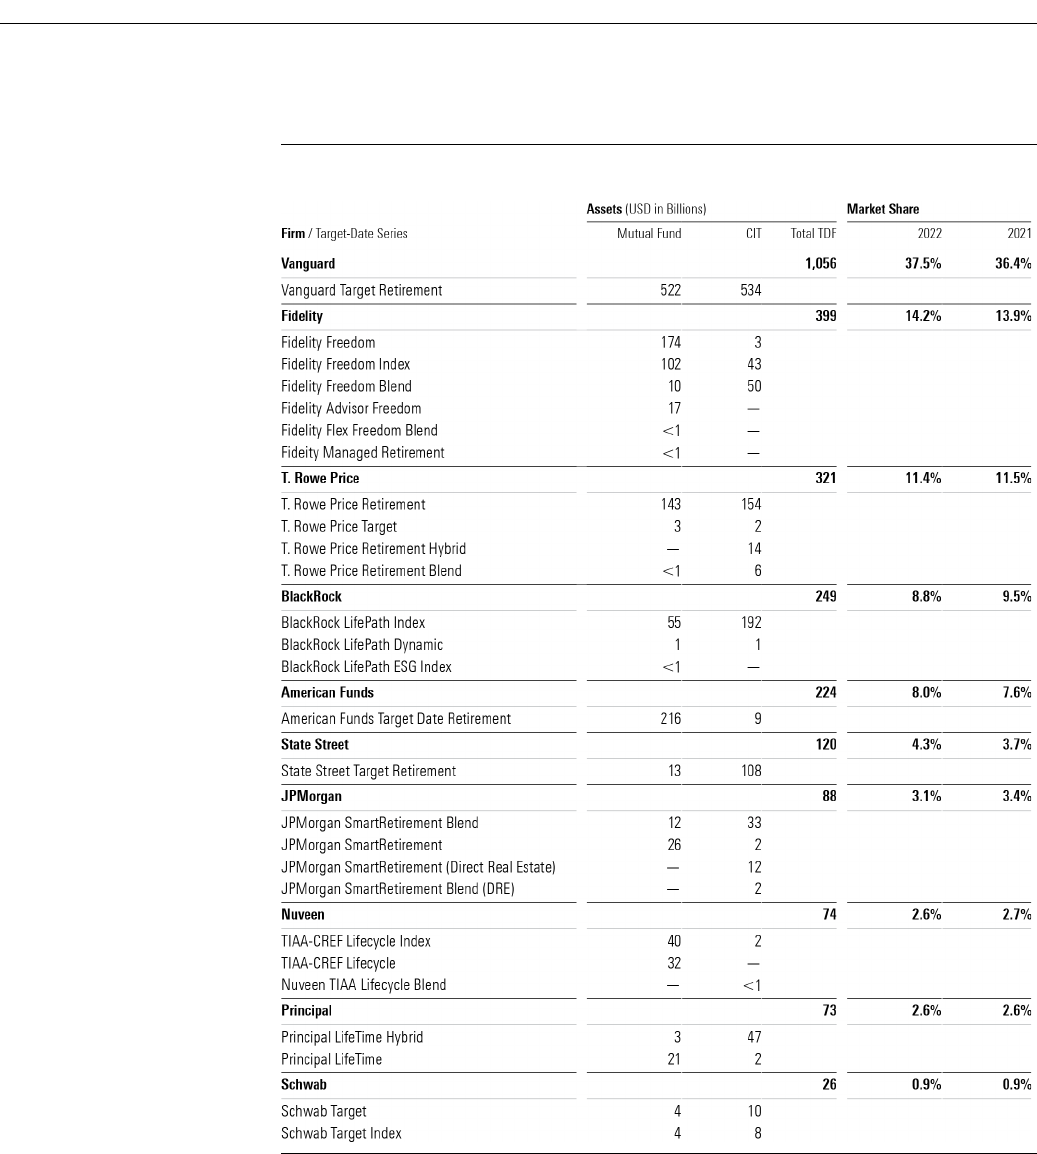
The Asset Managers Running the Industry
A handful of asset managers still dominate the target-date market. The top five providers control about
80% of its market share; the top 10 claim roughly 93%. Those numbers have been growing and will likely
continue.
Target-Date Strategy Landscape: 2023 | See Important Disclosures at the end of this report.
Page 9 of 34
Exhibit
9 The 10 Largest Target-Date Asset Managers
Source: Morningstar Direct
, author's calculations, and surveyed data. Data as of 12/31/2022.
There were no big changes to the top 10 providers or their market shares in 2022. Vanguard sits at the
top with over $1 trillion in target-date assets and 37.5% of the industry’s market share. Its single cheap,
straightforward series is compelling.
Second-place Fidelity’s nearly $400 billion in assets across six series is less than half of Vanguard’s.
Fidelity Freedom Index’s recent net inflows have more than offset the all-active Fidelity Freedom series’
Target-Date Strategy Landscape: 2023 | See Important Disclosures at the end of this report.
Page 10 of 34
net outflows. The latter series saw its ninth-straight year of outflows in 2022, though the opening of a
lower-cost CIT version could stem the tide.
T. Rowe Price, still in third place with over 11% market share, also has seen outflows from the mutual
fund version of its T. Rowe Price Retirement series, but inflows into its CIT version have more than
compensated.
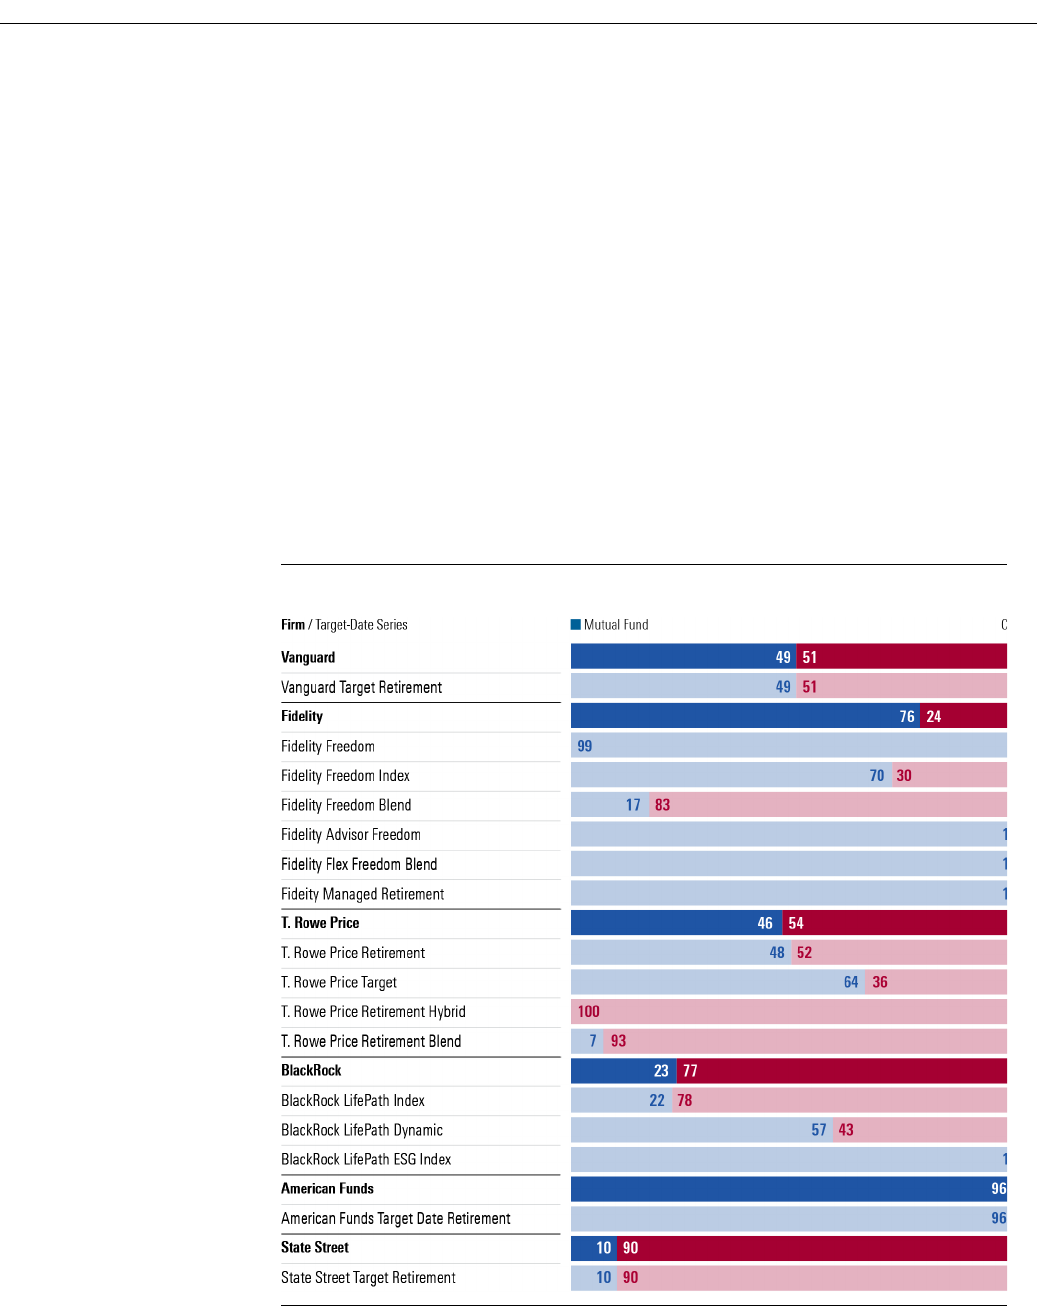
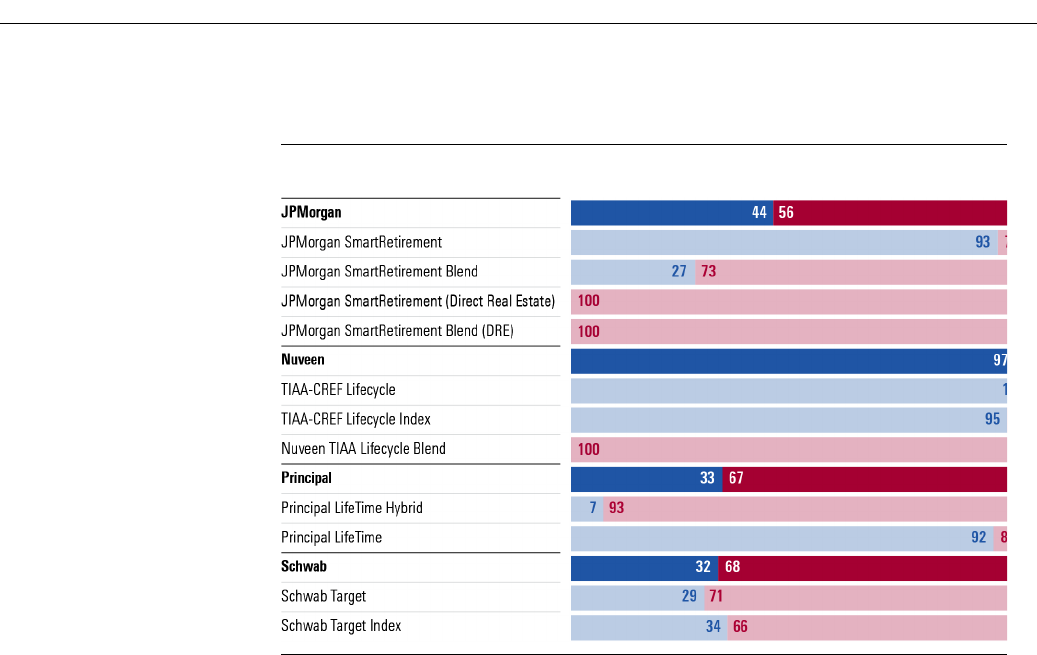
Where the CIT Assets Are Located
In 2022, Vanguard’s target-date assets flipped—51% of its series' assets are now in CITs rather than
mainly residing in mutual funds. Greater percentages of T. Rowe Price, BlackRock, State Street,
JPMorgan, Principal, and Schwab’s target-date assets are in CITs. State Street has the biggest share of
its assets in CITs: 90%. Exhibit 10 illustrates the 10 largest providers’ CIT and mutual fund split, as well
as the division for each of their series.
Exhibit 1
0 The 10 Largest Target-Date Asset Managers Mutual Fund and CIT Splits (Continued)
Source: Morningstar Direct
, author's calculations, and surveyed data. Data as of 12/31/2022.
Target-Date Strategy Landscape: 2023 | See Important Disclosures at the end of this report.
Page 11 of 34
Exhibit 1
0 The 10 Largest Target-Date Asset Managers Mutual Fund and CIT Splits (Continued)
Source: Morningstar Direct
, author's calculations, and surveyed data. Data as of 12/31/2022.
Most of Fidelity, American Funds, and Nuveen’s assets are in mutual funds. Fidelity Freedom and Fidelity
Freedom Index, the firm’s two largest series, each have more assets in their mutual fund versions, and
Fidelity Freedom Index has seen more mutual fund than CIT inflows, contrary to industry trends. Fidelity
Freedom Blend, however, has 93% of its assets in its CIT vehicle, which it launched in 2007, 11 years
before opening a mutual fund clone. American Funds has 96% of its target-date assets in mutual funds;
flows into the CIT version of the series launched in 2019 have been slow.
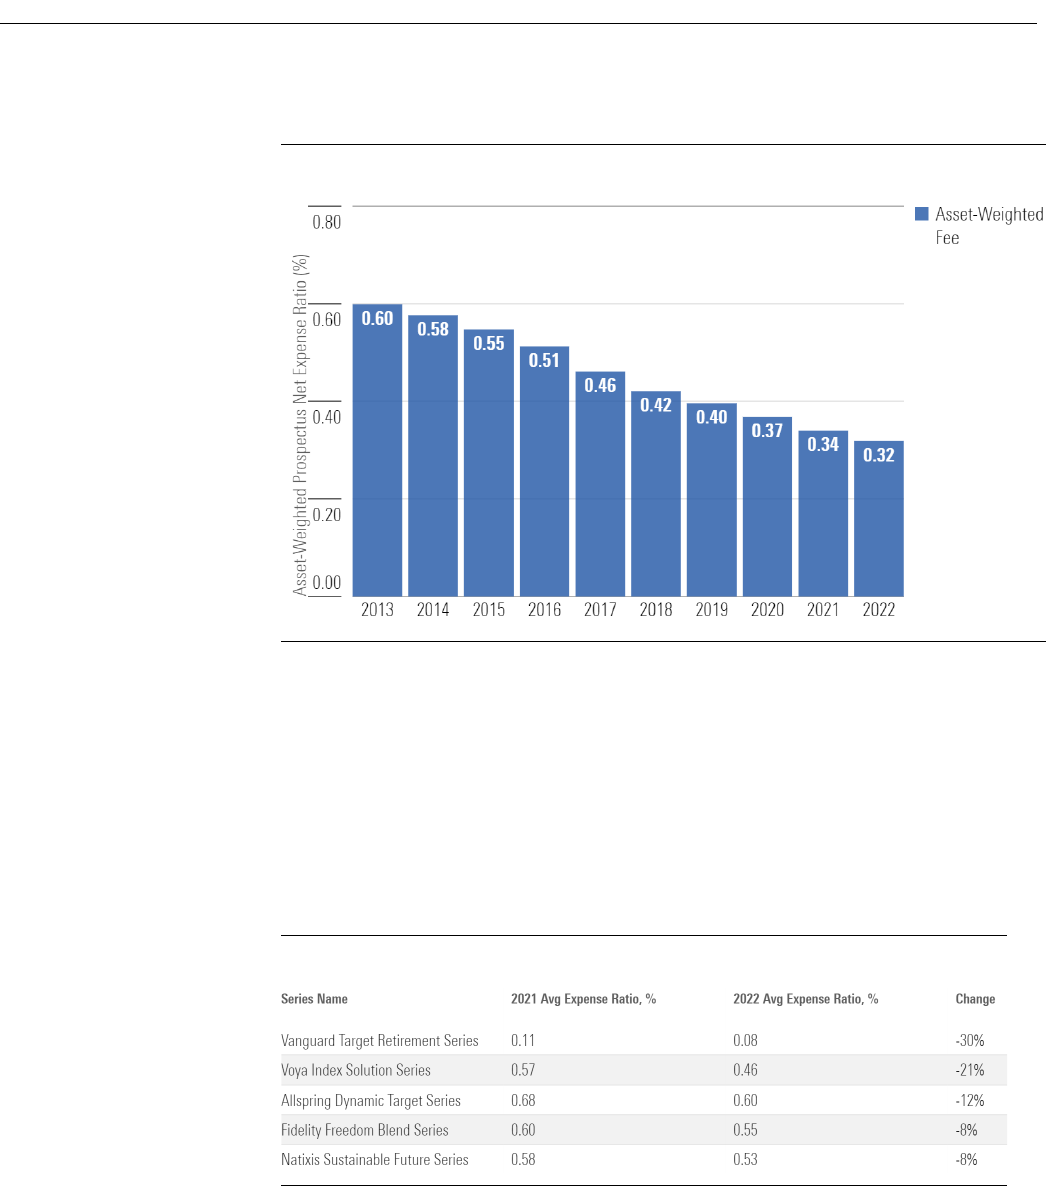
Investors Push Costs Down
Flows to lower-cost options show investors are choosing to pay less. Exhibit 11 shows the asset-
weighted average fee across all target-date mutual fund share classes over the past decade, including
shuttered funds, based on their prospectus-adjusted expense ratio and year-end net assets. This metric
provides the clearest view of what investors are paying for their target-date funds. CIT fee data are not
as transparent and therefore are not included, but anecdotal evidence indicates CITs would lower the
average asset-weighted fee.
Target-Date Strategy Landscape: 2023 | See Important Disclosures at the end of this report.
Page 12 of 34
Exhibit 11
Target-Date Funds' Year-End Asset-Weighted Expense Ratio, 2013-22
Source: Morningstar Direct and author's calculations. Data as of 12/31/2022. Excludes zero
-fee share classes.
The asset-weighted fee has dropped almost 7% annually, on average, over the past decade. It shed
roughly 6% in 2022, dropping to 32 basis points from 34 basis points. Since 2013, expenses have nearly
halved—a significant improvement for retirement savers.
There also were some fee reductions. The five series below reduced their average prospectus-adjusted
net expense ratios the most, on average, across all share classes from 2021 to 2022.
Exhibit 12
Average Target-Date Prospectus-Adjusted Expense Ratio
Source: Morningstar Direct
and author's calculations. Data as of 12/31/2022.
Vanguard Target Retirement series saw the largest drop in average fees paid. Investors in its retail share
class were the largest beneficiaries. They had paid an average of 0.14% but that dropped to 0.08% after
the firms merged the series' institutional and retail shares into a single share class in late 2021 and early
Target-Date Strategy Landscape: 2023 | See Important Disclosures at the end of this report.
Page 13 of 34
2022. Investors in institutional shares got a smaller fee cut of a 0.01 percentage point. The unusual fee
reduction will benefit savers immediately and over the long run.
Fidelity Freedom Blend, one of the top 10 asset-gatherers among mutual fund target-date series in 2022,
also cut fees. In April, it slashed the series’ K6 and Premier share class fees by 0.05% and 0.04%,
respectively.
Fees Continue to Move Down
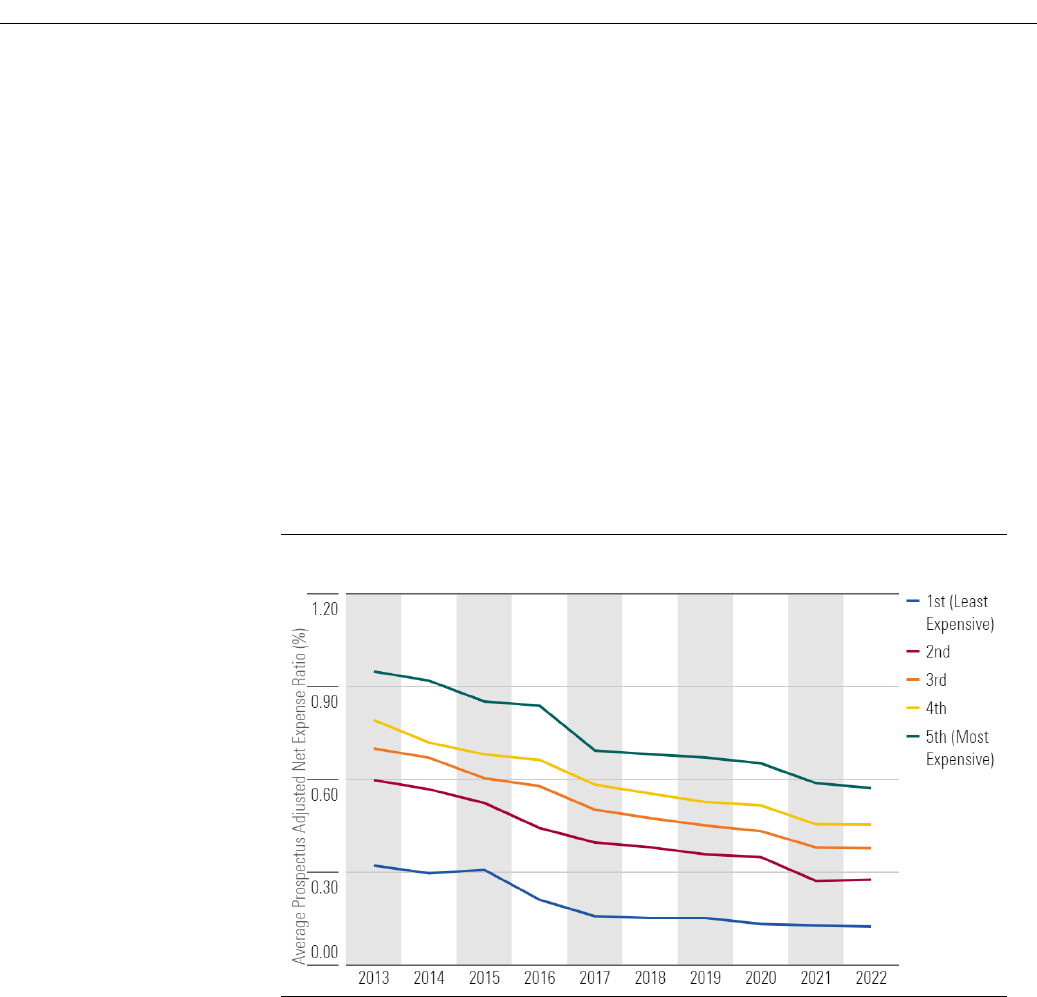
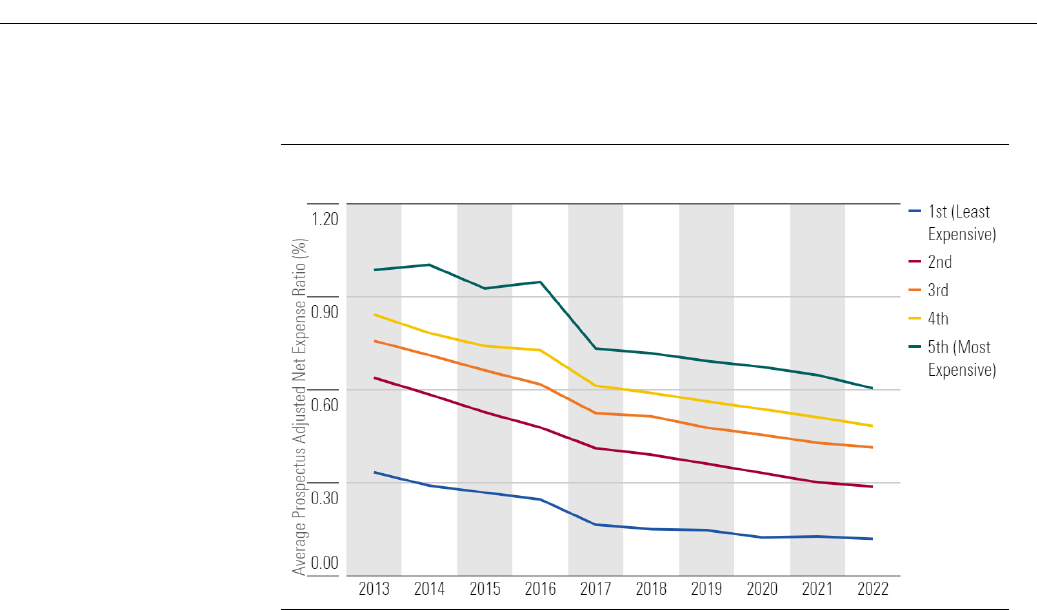
In 2022, target-date mutual fund fees continued to fall. Exhibits 13 and 14 depict the average year-end
prospectus-adjusted net expense ratio for the cheapest share class of all 2025 and 2045 target-date
funds, including shuttered funds, separated by fee quintile. The downward trend has gathered steam in
the last decade.
Exhibit 13
Average Year-End Prospectus-Adjusted Net Expense Ratio by Fee Quintile for 2025 Funds
Source: Morningstar Direct
and author's calculations. Data as of 12/31/2022.
Target-Date Strategy Landscape: 2023 | See Important Disclosures at the end of this report.
Page 14 of 34
Exhibit
14 Average Year-End Prospectus-Adjusted Net Expense Ratio by Fee Quintile for 2045 Funds
Source: Morningstar Direct
and author's calculations. Data as of 12/31/2022.
Since 2013, the average fee of each quintile plunged. Fees for the 2025 and 2045 vintages
fell by 49% through December 2022. On an absolute basis, the most expensive quintile for both vintages
experienced an average drop of 38 basis points, the largest among the groups. The cheapest cohorts,
which have less room to reduce fees, saw drops of 20 and 21 basis points, respectively.
As the cheapest target-date funds inch closer to their price floors, their cost advantage relative to the
middle quintile has steadily narrowed. A decade ago, they held 38- and 42-basis-point leads,
respectively, which has since been whittled down to 30 and 25 basis points, respectively.
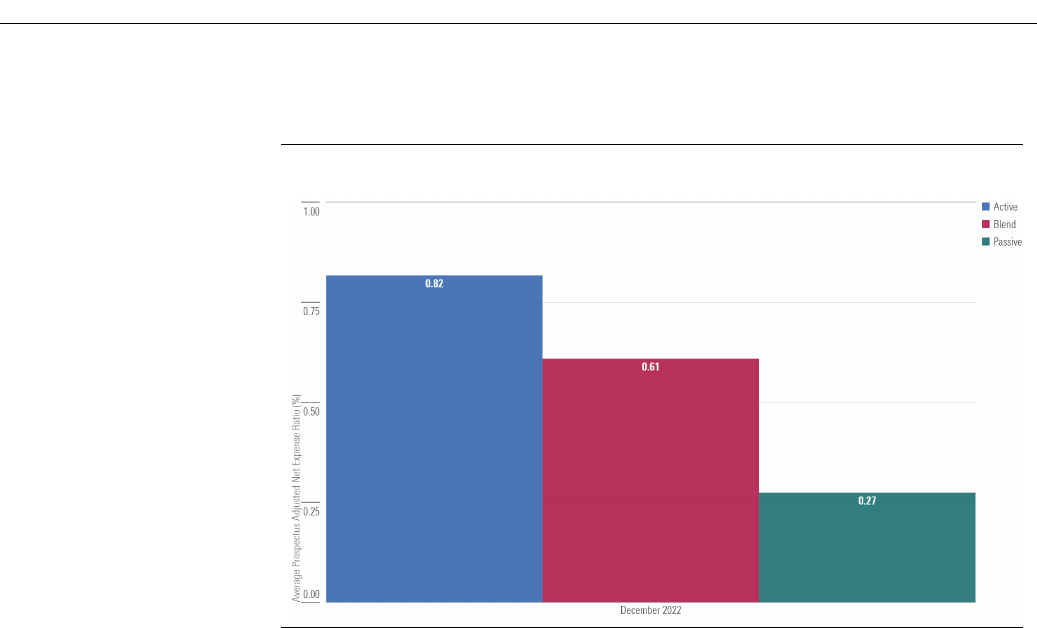
Index-Based Series Have a Big Fee Advantage
Target-date mutual fund portfolios composed of mostly index funds are cheaper. To illustrate the fee
advantage, we sorted target-date mutual fund series by their average index fund exposure across all
vintages. We called series with greater than 75% index fund exposure passive, those with less than 25%
of their assets in index funds active, and blend, for those in between. (Morningstar considers all target-
date series actively managed since portfolio managers make asset-allocation and glide path decisions;
these tags describe series’ underlying holdings.) Exhibit 15 depicts the average prospectus-adjusted net
expense ratio for each group as of December 2022.
Target-Date Strategy Landscape: 2023 | See Important Disclosures at the end of this report.
Page 15 of 34
Exhibit 15
Average Prospectus-Adjusted Net Expense Ratio by Series Construction
Source: Morningstar Direct and author's calculation. Data as of 12/31/2022.
Index-based series remain the low-cost leaders. Their average expense ratio of 0.27% is 55 and 34 basis
points lower than the active and blend series' averages, respectively. This helps explain index target-
date strategies’ popularity.
Blend series have gained popularity in recent years among investors who don’t view the active/passive
debate as an either/or question. Blend series’ 0.61% average fee is 21 basis points lower than the active
series average. That’s not as cheap as indexed series, but every basis point counts among competitively
priced target dates.
Target-Date Strategy Landscape: 2023 | See Important Disclosures at the end of this report.
Page 16 of 34
Morningstar's Top Target-Date Strategies
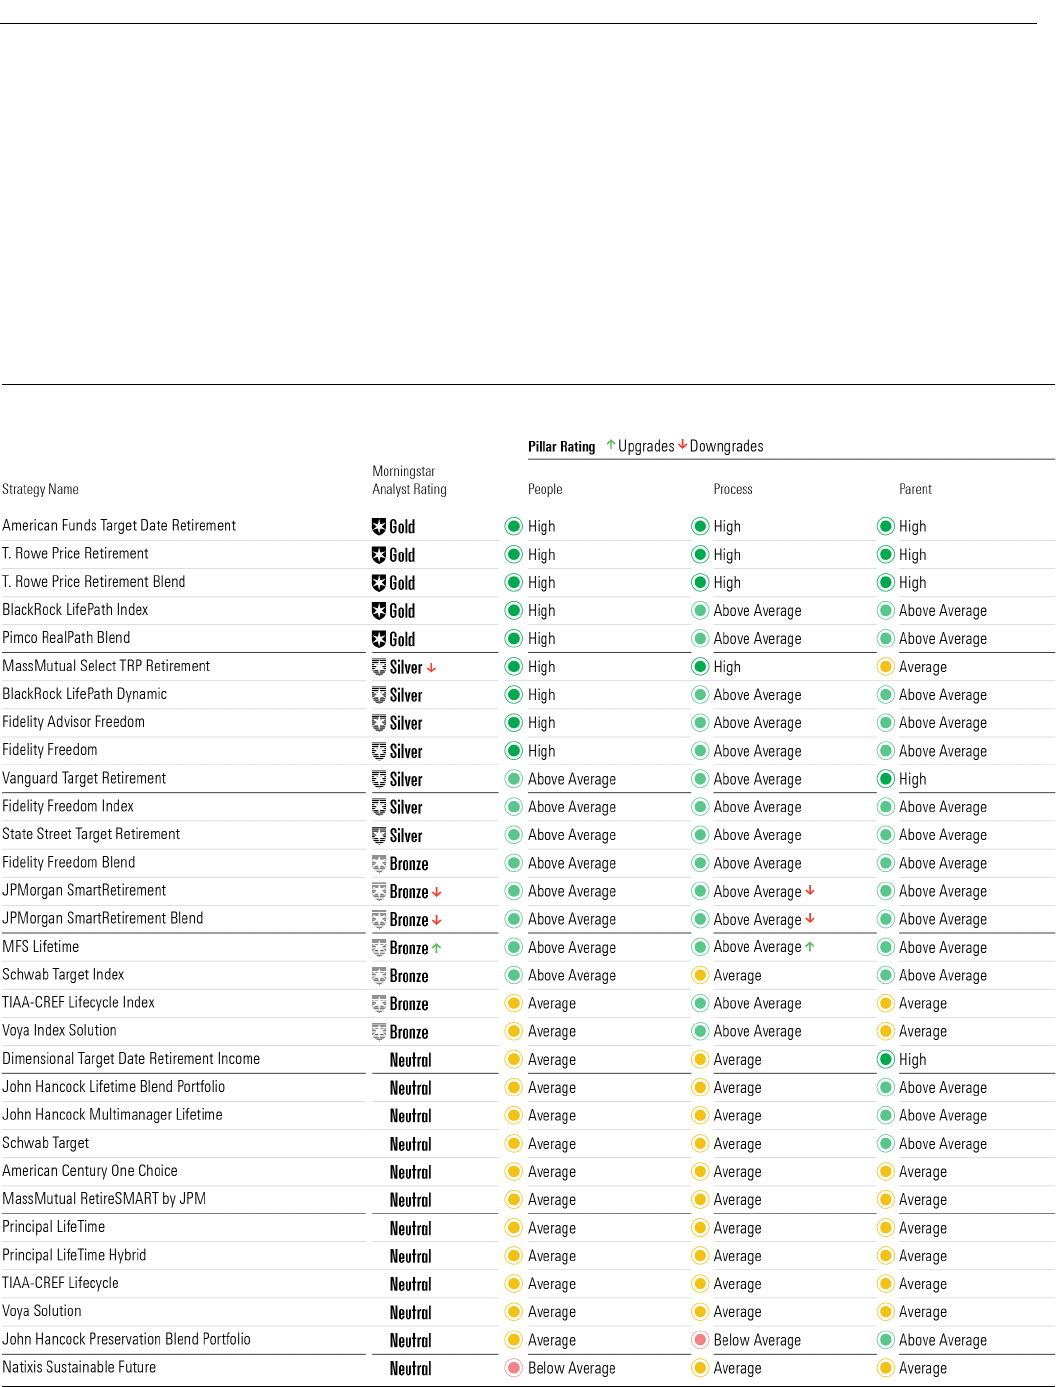
Exhibit 16 shows ratings assigned to the cheapest share class of the target-date mutual fund series
covered by Morningstar analysts, as of March 2023. It also highlights how the Morningstar Analyst
Rating, and People, Process, and Parent Pillars changed between March 2022 and March 2023. One
series earned an Analyst Rating upgrade, three received downgrades, and three were added to
coverage.
Exhibit 16
Morningstar Analyst Ratings for Target-Date Mutual Funds
Source: Morningstar Direct. Data as of 3/28/2023

Target-Date Strategy Landscape: 2023 | See Important Disclosures at the end of this report.
Page 17 of 34
MFS Lifetime’s well-regarded fund lineup, management team, and solid long-term strategy give the
series a competitive edge. The team’s consistent execution of its well-reasoned investment approach
supported a Process rating upgrade to Above Average from Average, driving its Analyst Rating to Bronze
from Neutral.
JPMorgan SmartRetirement Blend series and JPMorgan SmartRetirement series’ Process ratings were
downgraded to Above Average from High due to an increasingly competitive landscape and waning
confidence in their process. The team has seen turnover in recent years, and its tactical moves, which
previously set them apart, have become inconsistent. As a result, the series’ Analyst Ratings fell to Silver
and Bronze, respectively.
T. Rowe Price Retirement Blend debuted with a Morningstar Analyst Rating of Gold. The CIT version,
which has a longer track record, has earned the same rating since it was brought under coverage in
2021. The strong team mixes the firm’s topnotch active funds with some indexed strategies to build
portfolios and keep costs low. This combination should continue to serve investors well.
Morningstar picked up coverage of Fidelity Freedom Blend series in October 2022 with an inaugural
Analyst Rating of Bronze for its cheapest share classes. Run by Fidelity’s strong asset-allocation group,
this series fills the middle ground between the firm’s existing active-based and index-based Freedom
series. The managers use active funds where they feel Fidelity has an edge, like growth stocks, and
where they think markets are less efficient, such as emerging markets.
The Voya Index Solution series employs an active asset-allocation approach with appropriate risk
controls. The series uses index funds and will make tactical moves. Morningstar brought it under
coverage in late March 2022, and its cheapest share class earns a Morningstar Analyst Rating of Bronze.
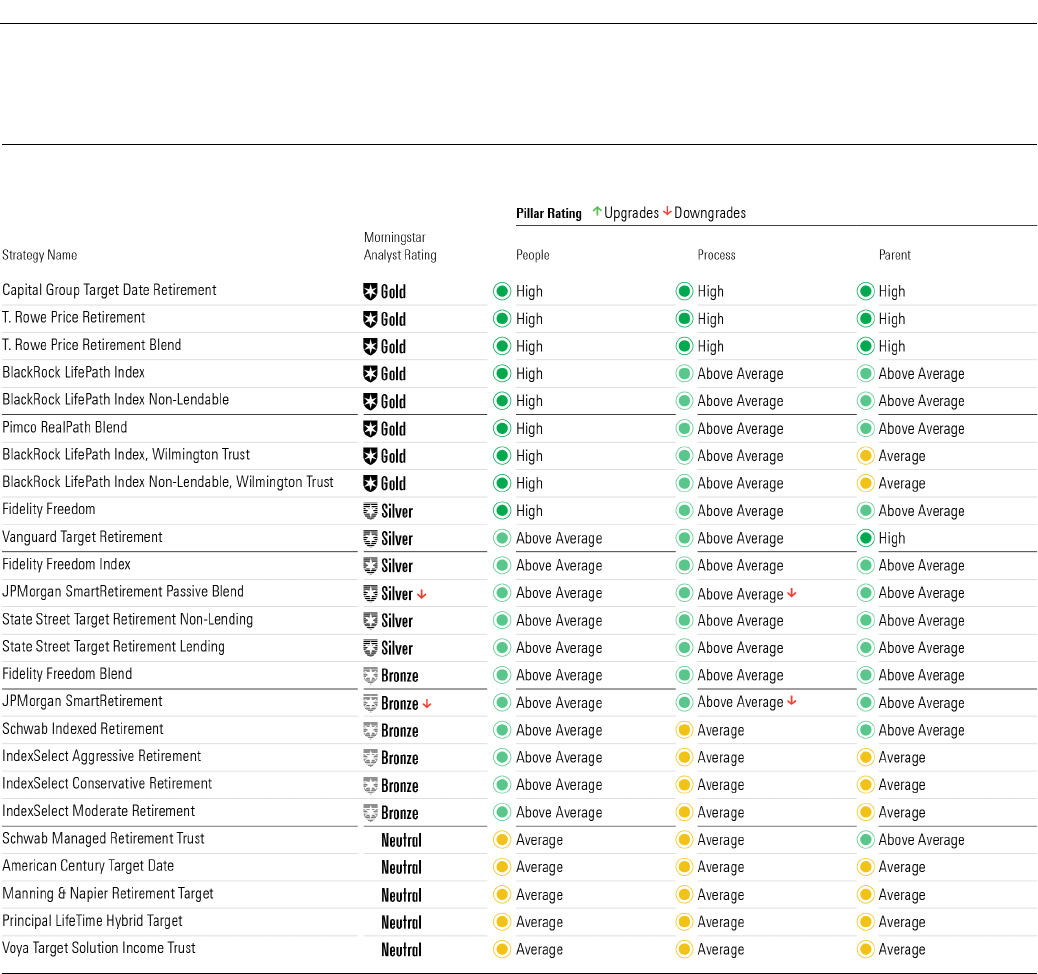
Morningstar analysts currently cover 25 CIT target-date series, shown in Exhibit 17, which are mostly
clones of their mutual fund counterparts. The target-date series from Manning & Napier and
IndexSelect, however, are only available as CITs and receive unique Morningstar Analyst Ratings.
Target-Date Strategy Landscape: 2023 | See Important Disclosures at the end of this report.
Page 18 of 34
Exhibit
17 Morningstar Analyst Ratings for Target-Date CITs
Source: Morningstar Direct. Data as of
3/28/2023
Fidelity launched a CIT version of its flagship series, Fidelity Freedom, in 2022. Its debut Morningstar
Rating of Silver matches that of its cheapest mutual fund share class. The same well-resourced asset-
allocation team and tenured portfolio managers run this series. Their research-intensive approach has
led to measured adjustments over time, primarily to improve diversification.
JPMorgan SmartRetirement and SmartRetirement Blend implement the same process as the mutual
fund version. Both series’ Process Pillars fell to Above Average from High due to concerns about the
team’s tactical approach, which dropped their Analyst Ratings to Bronze and Silver, respectively.
Target-Date Strategy Landscape: 2023 | See Important Disclosures at the end of this report.
Page 19 of 34
2022: The Year (Almost) Nothing Worked
Target-date strategies are designed to be hands-off all-in-one solutions for investors’ retirement savings.
Their diversified portfolios that gradually and systematically get less risky as retirement approaches
appeal to those seeking to invest with a minimum of fuss. Still, market turbulence shows target-date
strategies aren’t immune to market shocks and aren’t all built the same.
Diversification across stocks and bonds has usually helped during market turmoil and over the long term.
Sometimes, however, correlations between major asset classes, such as stocks and bonds, spike and
there’s nowhere to hide. That happened in 2022 as stock and bond markets fell in tandem as the Federal
Reserve reined in loose monetary policy with seven interest-rate hikes, Russia invaded Ukraine, a
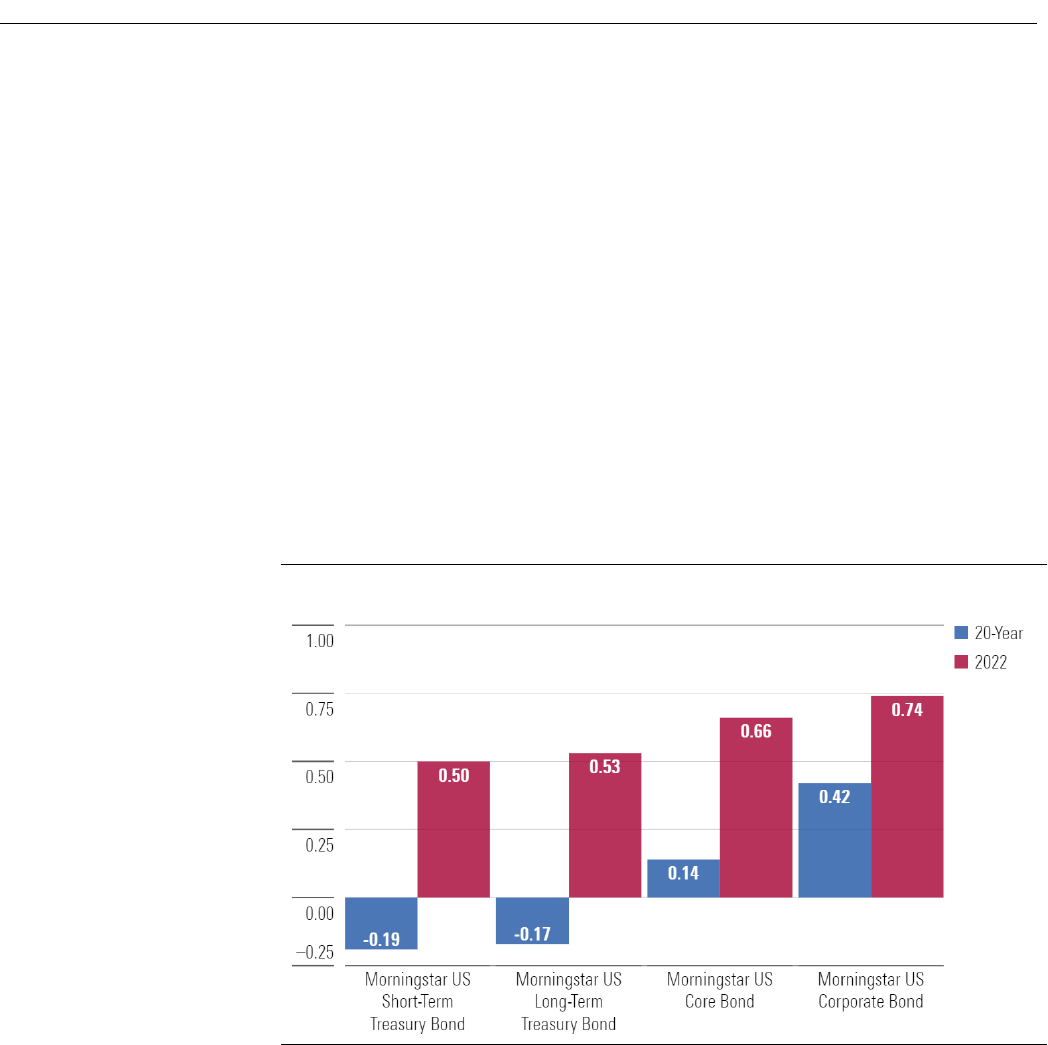
cryptocurrency exchange imploded, and investors grew wary of any kind of risk. Exhibit 18 illustrates the
correlation between stocks and bonds over the past 20 years and in 2022.
Exhibit 18
Correlations Between Stocks and Bonds
Source: Morningstar Direct. Data as of
12/31/2022.
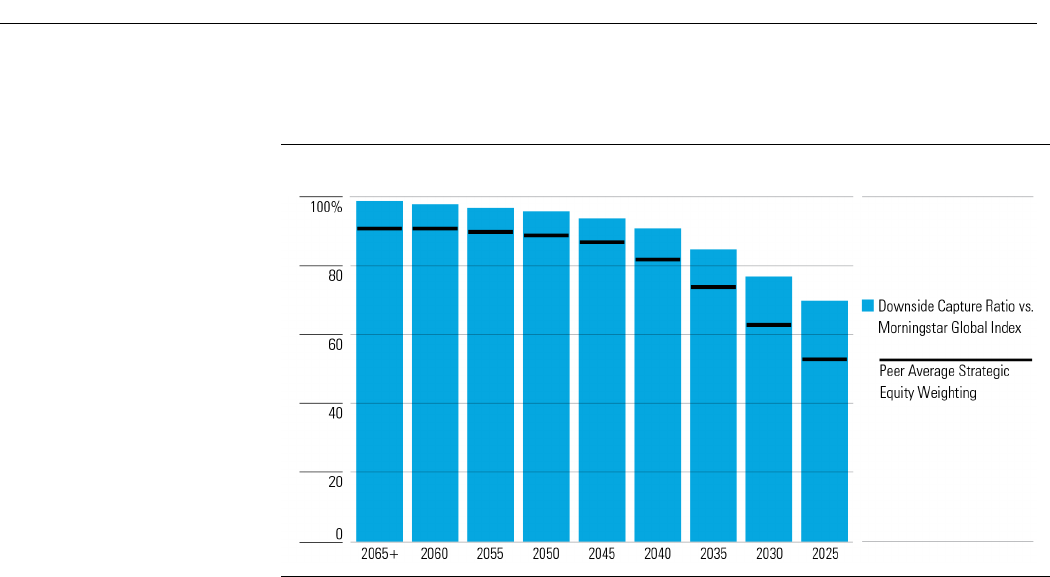
Target-date portfolios constructed on the historical assumption that investment-grade bonds would
serve as a ballast in rough markets suffered as their stock and bond holdings fell in 2022. Exhibit 19
shows that target-date funds captured more of the equity market’s downside than expected based on
their strategic equity weightings.
Target-Date Strategy Landscape: 2023 | See Important Disclosures at the end of this report.
Page 20 of 34
Exhibit 19
Downside Capture Ratio vs. Peer Average Strategic Equity Weighting
Source: Morningstar Direct. Data as of 12/31/2022.
Younger Investor Results
Losses hurt at any age, but younger investors tend to have smaller balances and longer time periods
over which they can recover. A 20% loss on $10,000 amounts to $2,000, but the same drawdown on
$1,000,000 is $200,000. A younger investor in the former scenario can make up the difference with
future contributions and appreciation, but an investor closer to retirement in the latter situation has less
time and opportunity to recoup losses. A retiree may even have to lock in losses to withdraw money on
which to live, reducing principal and increasing the odds of running out of money.
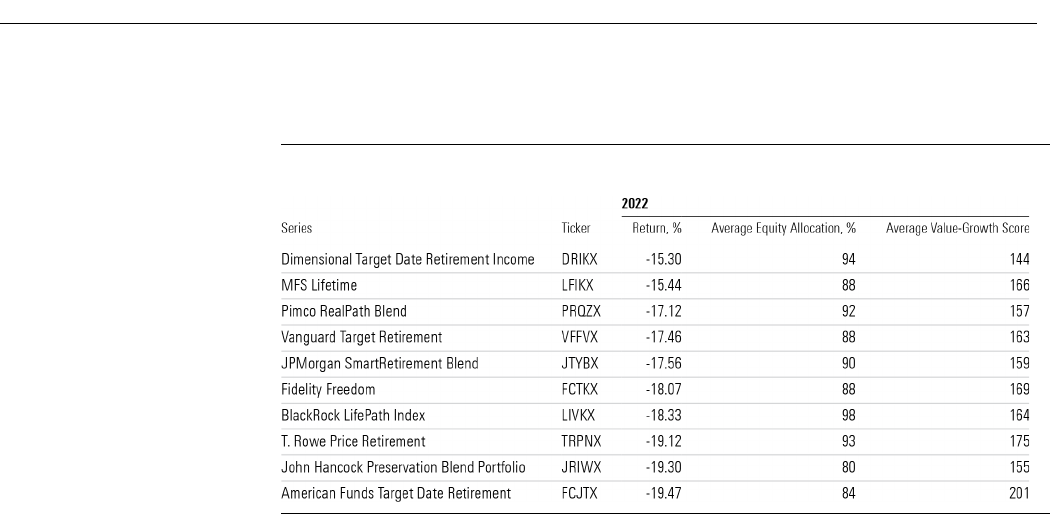
Target-date strategies tend to start with similar equity allocations but diverge over time. Exhibit 20
shows the 2022 returns for some prominent or distinctive target-date series’ 2055 vintages.
Target-Date Strategy Landscape: 2023 | See Important Disclosures at the end of this report.
Page 21 of 34
Exhibit 2
0 2055 Vintage's Equity Exposure and Returns
Source: Morningstar Direct. Data as of
12/31/2022.
Dimensional Target Date Retirement Income, MFS LifeTime, and Pimco RealPath Blend experienced
shallower losses compared with peers. All three have middling equity exposure and less growth stock
exposure, according to Morningstar’s value-growth score (the higher the number, the more growth
exposure).
Fidelity Freedom and BlackRock LifePath Index fell to the middle of the pack, despite BlackRock’s
relatively high equity allocation at the start of its glide path. It captured more than 100% of the global
equity markets' drawdown, but its performance on the upside gave it a boost.
American Funds Target Date Retirement suffered steep losses. Its equity allocation is on the lower end
compared with peers, but its series tends to favor growth stocks early in the glide path and value later;
that leaning hurt it in 2022 as value outperformed growth. Its results look better over the past decade
when large-cap growth stocks rallied.
Near Retirement Results
As stated earlier, drawdowns hurt investors closer to or in retirement more because they should have
bigger balances and plans to switch from contributions to withdrawals. Target dates designed for
investors retiring in 2025, a good proxy for people near or in retirement, all lost money regardless of their
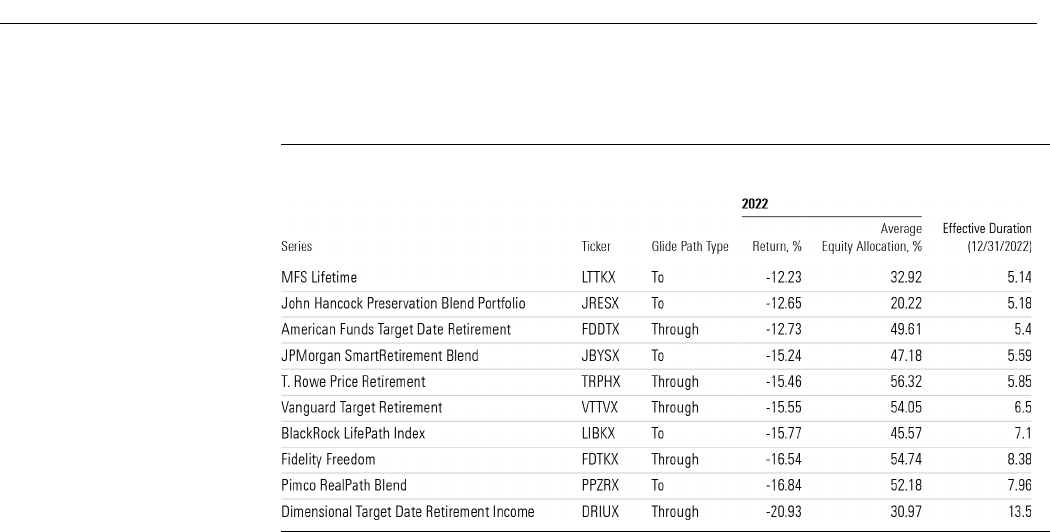
glide paths or underlying exposures. Exhibit 21 shows the 2022 returns for the 2025 vintages of the same
10 series highlighted above.
Target-Date Strategy Landscape: 2023 | See Important Disclosures at the end of this report.
Page 22 of 34
Exhibit 2
1 2025 Vintage's Returns, Equity Exposure, and Effective Duration
Source: Morningstar Direct. Data as of
12/31/2022.
MFS Lifetime and John Hancock Preservation Blend Portfolios lost the least. Both use “to” glide paths
that stop lowering stock exposure at the target retirement date, rather than “through” glide paths that
continue to lower stock exposure for 10 to 15 years after the retirement date. So, they have lower equity
allocations than their “through” peers, which buoyed their results compared with more equity-heavy
peers. MFS Lifetime’s diversified exposures and steep glide path have kept it competitive over longer
periods that include equity rallies, but John Hancock Preservation Blend Portfolio’s conservative stance
has caused it to lag over longer time periods.
Despite their double-digit declines, T. Rowe Price Retirement and Fidelity Freedom’s managers still favor
“through” glide paths because they think protecting investors against longevity risk, or the chance
investors will outlive their savings, is important. T. Rowe Price Retirement delivered slightly shallower
losses than Fidelity Freedom even with a higher equity allocation. The latter’s longer duration
contributed to its larger drawdown.
Pimco RealPath Blend and Dimensional Target Date Retirement are at the bottom in part due to the
longer duration, which left them more vulnerable to rising interest rates in 2022. Pimco RealPath Blend’s
2025, however, still has beaten 70% and 64% of its peers over the trailing three and five years,
respectively, through December 2022. Dimensional 2025 Target Date Retirement results over the same
time periods are more mixed, beating 42% and 26% of peers, respectively. Both series’ management
teams still think a longer duration is better over the long term for retirees and do not plan to rein in their
portfolios’ duration.
TIPS Didn't Keep Up With Inflation
Treasury Inflation-Protected Securities, or TIPS, which most target-date strategies layer into their
portfolios as they approach retirement, were more of a hurt than an inflation hedge in 2022. TIPS adjust
investor principal for inflation, but they also tend to be interest-rate sensitive, so rising rates swamped
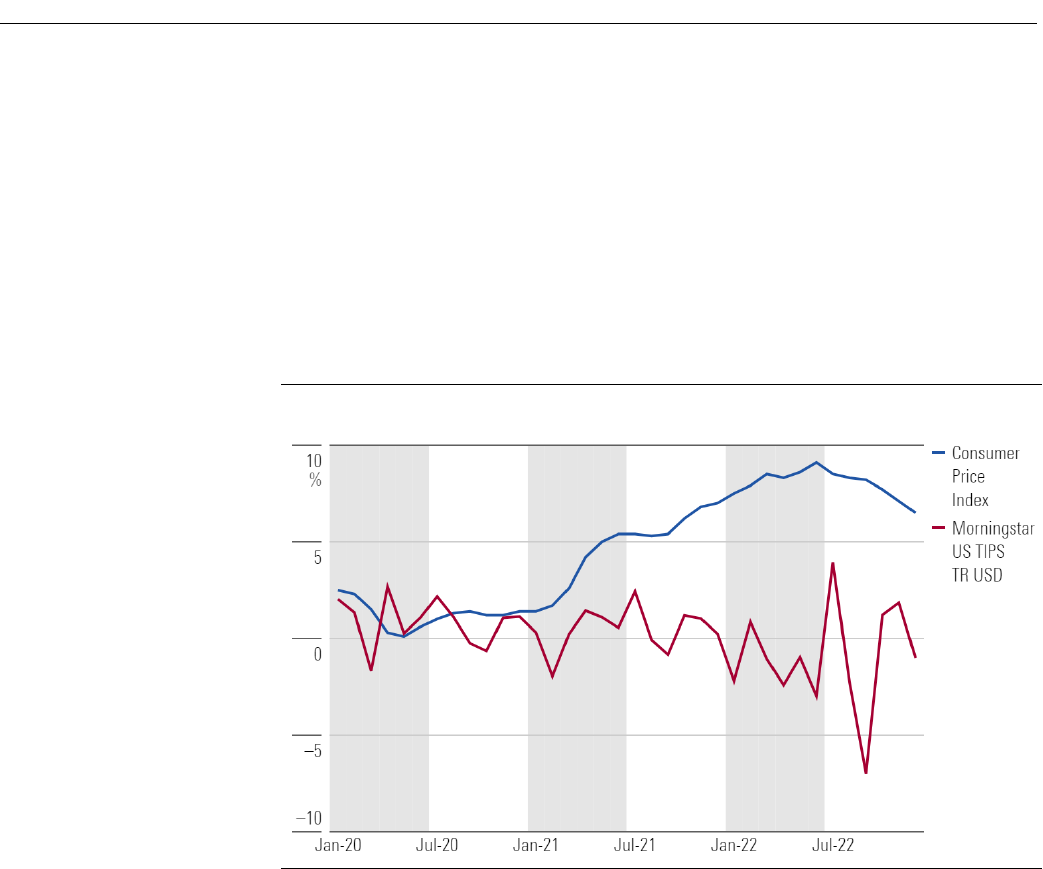
Target-Date Strategy Landscape: 2023 | See Important Disclosures at the end of this report.
Page 23 of 34
them like other bonds. While TIPS were the best-performing major bond market sector in 2021—the
Morningstar U.S. TIPS Index rose 5.7% as the Morningstar U.S. Core Bond Index lost 1.6%—the tables
turned in 2022. Yes, inflation spiked, but that forced the Fed to aggressively raise rates. TIPS lost nearly
12% as the Consumer Price Index posted a 6.5% increase for the 12 months ended in December, though
it hit much higher trailing levels at points during the year. Target-date strategies count on TIPS for long-
term inflation protection, but they still failed to fulfill their intended role in 2022. Exhibit 22 compares the
two indexes.
Exhibit 22
Consumer Price Index and TIPS Performance
Source:
Morningstar Direct and Bureau of Labor Statistics. Data as of 12/31/2022.
Shorter-duration TIPS exposure took some of the edge off the asset classes' dismal performance for
target-date strategies. Exhibit 23 shows the five biggest target-date strategies by assets and their
underlying TIPS fund.
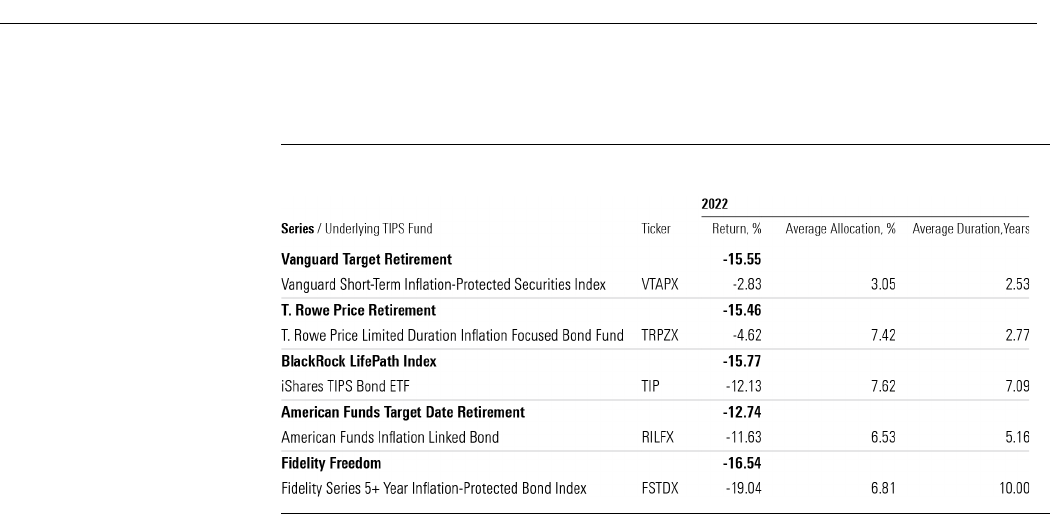
Target-Date Strategy Landscape: 2023 | See Important Disclosures at the end of this report.
Page 24 of 34
Exhibit 23
TIPS Exposure—2025 Vintage
Source: Morningstar Direct. Data as of
12/31/2022.
Vanguard and T. Rowe Price’s TIPS funds, both shorter-duration offerings, kept losses under 5%. TIPS
funds with longer durations did worse. Fidelity Series 5+ Year Inflation-Protected Bond Index FSTDX, a
component of both the Fidelity Freedom and Fidelity Freedom Index 2025 funds, lost about 19% in 2022
due to its 10-year average duration in 2022. Fidelity funds lost about 16.5% in 2022.
A Safe Haven
In a year in which most safe haven asset classes were anything but, there was one port in the storm:
commodities. The Bloomberg Commodity Index gained 16% in 2022. Unfortunately, many target-date
managers lost conviction in the asset class and flushed it from their portfolios prior to 2022 due to its
lackluster performance. The Bloomberg Commodity lost nearly 4% annualized in the decade ending in
December 2021. Even the target-date funds that still held some commodities didn’t own enough to make
much of a difference. In fact, Fidelity Freedom was the only top 10 mutual fund series that owned some
commodities in 2022. It averaged 1.45% of assets in Fidelity® Series Commodity Strategy, which gained
nearly 15% for the year. BlackRock LifePath Index includes a strategic position to commodities in its CIT
version but not the mutual fund. The CIT averaged 1.42% of assets in the Commodity Index Daily Fund,
which gained more than 15% in 2022.
Beyond the top 10 series, commodities remain a rarity. Bronze-rated MFS Lifetime owns MFS Commodity
Strategy. Similar to BlackRock, State Street Target Retirement includes a commodity allocation in its CIT
but not its mutual fund strategy.
Exhibit 24 shows these series’ commodity exposure.
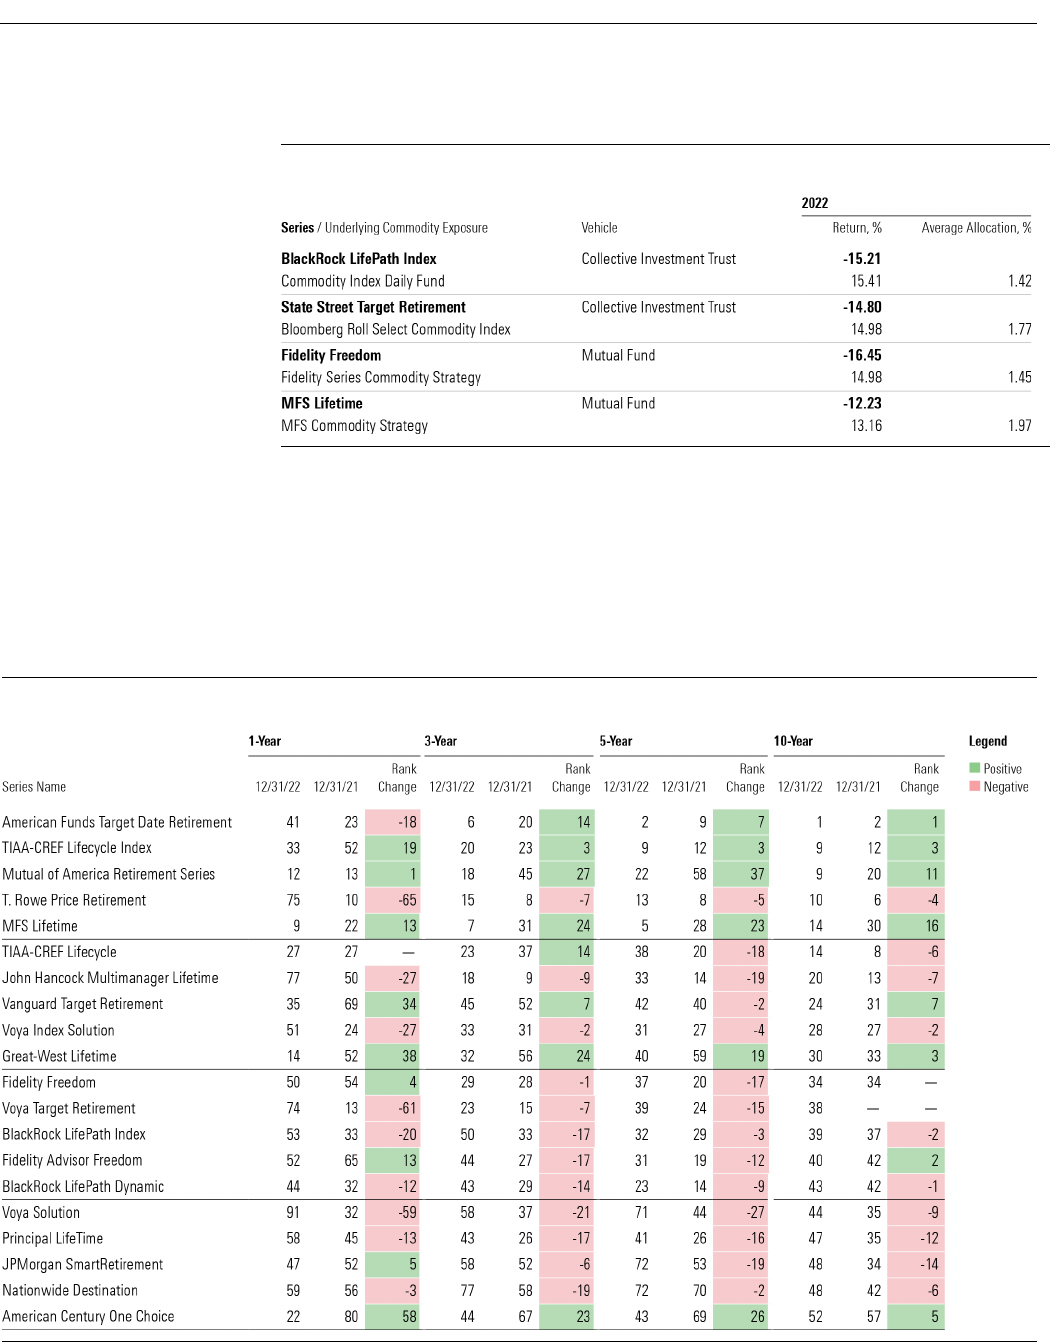
Target-Date Strategy Landscape: 2023 | See Important Disclosures at the end of this report.
Page 25 of 34
Exhibit 24
Commodity Exposure—2025 Vintage
Source: Morningstar Direct. Data as of 12/31/2022.
Leaders and Laggards After 2022's Market Volatility
Last year’s volatility shook up target-date series’ short-term performance rankings but did little to alter
the long-term ranks. Exhibit 25 shows the average category ranks for each series’ cheapest share class
based on total returns and its ranking’s year-over-year change.
Exhibit 25
Trailing Average Category Ranks by Target-Date Mutual Fund—Cheapest Share Class
Source: Morningstar Direct and author's calculation. Data as of 12/31/2022.
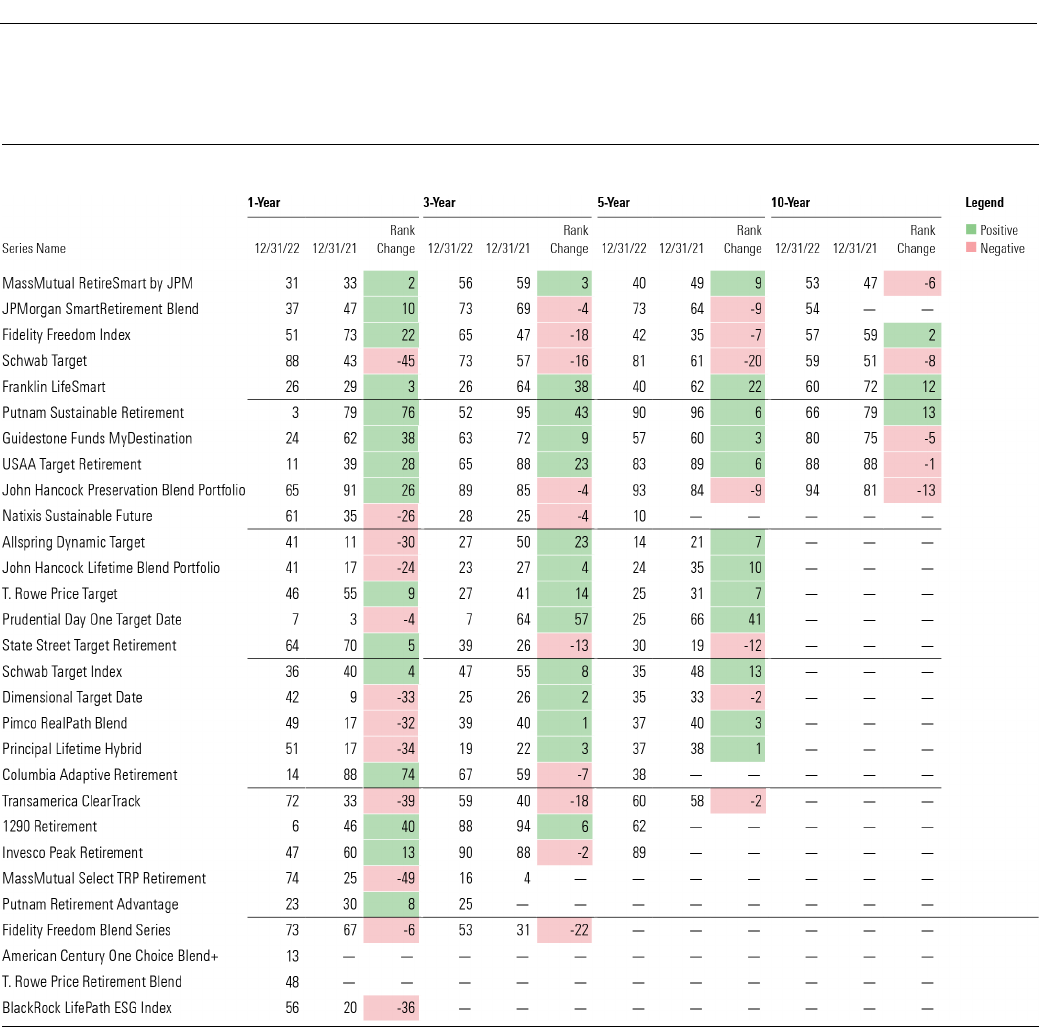
Target-Date Strategy Landscape: 2023 | See Important Disclosures at the end of this report.
Page 26 of 34
Exhibit 25
(Cont.) Trailing Average Category Ranks by Target-Date Mutual Fund—Cheapest Share Class
Source: Morningstar Direct and author's calculations. Data as of 12/31/2022
The American Funds Target Date Retirement series has been the top-performing series, based on total
returns, over the last decade, surpassing TIAA-CREF, whose index series ranks second, and T. Rowe
Price Retirement. American Fund’s series lets the underlying managers’ drive asset-allocation tilts,
which plays to the firm’s strengths: a large, experienced, globe-spanning roster of managers and
analysts plying sober strategies that have earned Morningstar Medals for funds comprising 90% of the
series’ assets—a remarkable feat for an active series.
T. Rowe Price Retirement rankings tumbled in 2022 due to its higher-than-average equity allocation and
poor security selection in some of its key underlying funds. Over the past decade its underlying active
managers and its equity tilt have been plusses.
Target-Date Strategy Landscape: 2023 | See Important Disclosures at the end of this report.
Page 27 of 34
MFS Lifetime series’ 10-year average ranking rose significantly in 2022 due to its strong underlying
funds and diversification. Over the past decade ending in December 2022, the institutional shares of
every vintage with a 10-year track record topped their respective category index and average peer group
on an absolute and risk-adjusted basis.
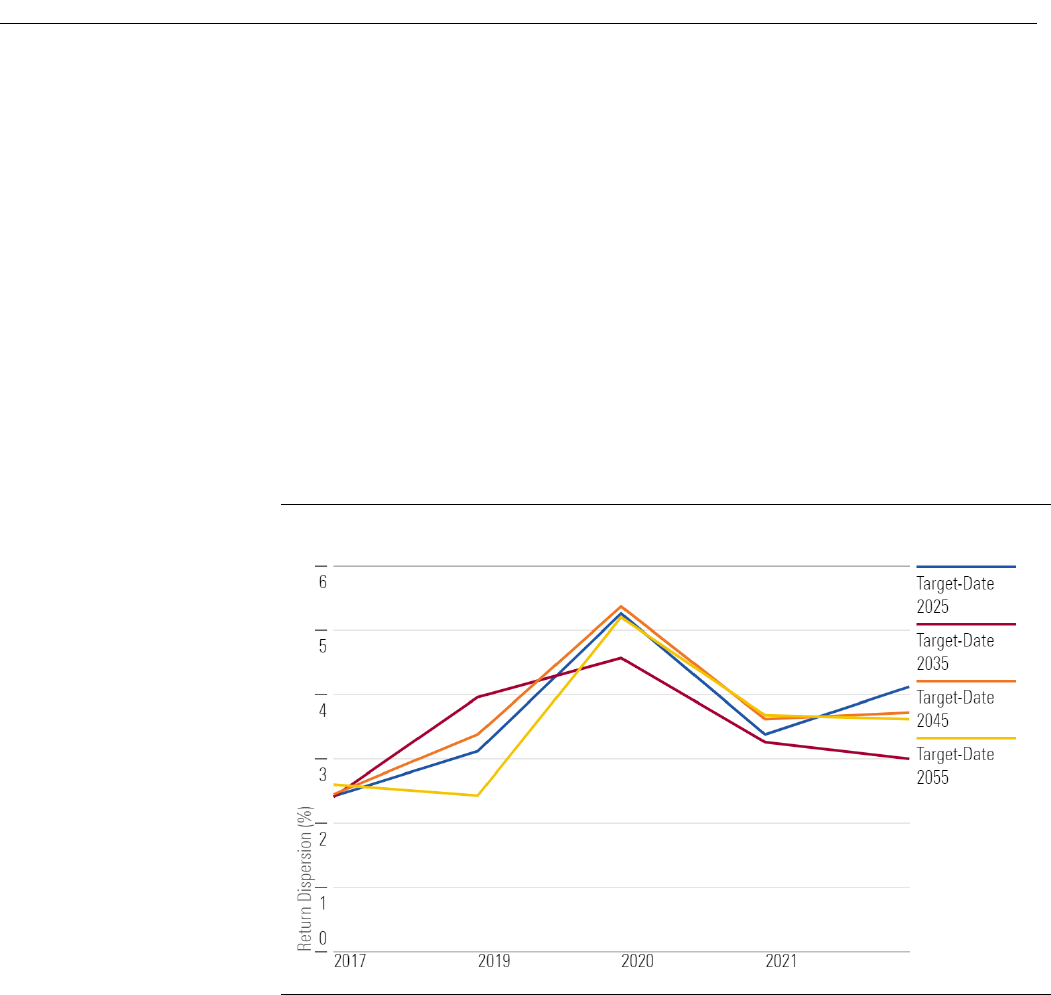
Narrowing Return Dispersions
Target-date funds continue to have a low dispersion of returns. These narrow performance differences
may make it seem like it doesn’t matter which series an investor has, but during periods of heightened
stock and bond market volatility, the seemingly small differences can become magnified. Exhibit 26
illustrates the range of returns of the cheapest share class returns over the past five years, excluding
major outliers for various target-date categories.
Exhibit
26 Calendar-Year Return Dispersion
Source: Morningstar Direct
and author's calculations. Data as of 12/31/2022.
In 2022, dispersions were higher than they were in 2018. For example, in 2022 across the 2025 vintage,
the range of returns, excluding major outliers, was slightly over 4% whereas it was 2.4% in 2018.
Notably, across all categories, the dispersions were the widest in 2020 before coming down slightly in
2021, and they remained relatively consistent in 2022.
Despite some vintages’ higher equity allocations, their return dispersions tend to be more closely aligned
with intermediate core bonds rather than the large-blend category and the 50% to 70% equity allocation
category. Exhibit 27 shows the 2022 dispersions of target-date series’ cheapest share class within
selected target-date fund Morningstar Categories versus other selected categories, excluding outliers. It
also shows that the dispersion doesn't shrink within target-date fund categories that hold more in
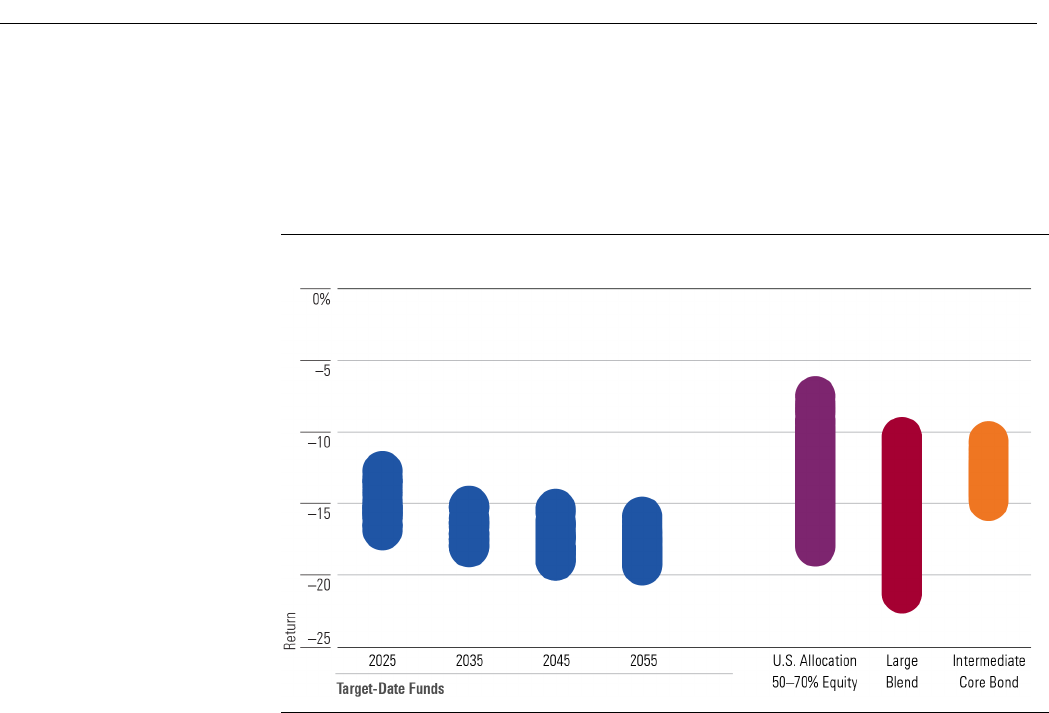
Target-Date Strategy Landscape: 2023 | See Important Disclosures at the end of this report.
Page 28 of 34
bonds, even though bond categories have tighter return dispersions than equity categories. In 2022, the
2055 vintage’s dispersion of returns of 3.6% was narrower than the intermediate core bond’s 4.6%
Exhibit 27
Dispersion of Returns Within Target-Date Categories (Cheapest Share Class), 2022
Source: Morningstar Direct and author's calculations. Data as of 12/31/2022.
Even though returns are somewhat similar, investors should still choose a target-date strategy that
offers the best odds of replacing their income in retirement or a strategy that allows them to comfortably
remain invested during tough periods like 2022.

Target-Date Strategy Landscape: 2023 | See Important Disclosures at the end of this report.
Page 29 of 34
Target-Date Legal Battles
Defined-contribution plan sponsors are no strangers to litigation. In recent years, numerous lawsuits
have accused them of using target-date strategies that charge excessive fees. In 2022, there were 82
excessive-fee lawsuits against 401(k) plans. That’s an 86% surge from 2021, but lower than 2020’s
record high of nearly 100, according to mutual fund industry news site Ignites. These lawsuits have
encouraged some plan sponsors to select cheaper target-date series to limit litigation risk, which helped
drive the $54 billion of inflows to the cheapest quintile of target-date mutual funds in 2022.
A new flurry of lawsuits in 2022, however, focused on performance. These lawsuits also cherry-picked a
small peer group to compare results against. Limiting the peer group to only a select few of the best-
performing series sets an unrealistically high bar for sponsors choosing investment options for their
plans. This poses a different set of considerations for plan sponsors trying to mitigate lawsuit risk, which
can potentially lead to performance-chasing and premature swapping out of the target-date strategies.
There are many considerations when assessing a target-date strategy. For example, one of the biggest
differentiators of target-date funds is whether they use a “to” glide path, which stops lowering stock
exposure at the target retirement date, or a “through” glide path, which continues to lower stock
exposure for 10 to 15 years after the retirement date. This decision can significantly impact relative
performance closer to retirement.
Also, past performance is not an accurate indicator of future performance. Today’s target-date funds are
different than the original offerings and tomorrow’s will be different from today's as providers continue
to evolve their strategies. For example, in 2014, BlackRock was one of the first firms to increase its
equity allocation early in the glide path. Its current strategic equity allocation for younger savers, such as
those currently in the 2060 and 2055 funds, is 99%. Similarly, T. Rowe Price Retirement boosted its
equity allocation across its glide path in 2020. As part of the changes, the series’ equity allocation
jumped to 98% at the beginning of the glide path, up from 90%. These changes can dramatically alter a
series’ risk and return profile, making historical comparisons difficult. Also, given the changing
allocations across the glide path, one vintage might outperform its peers while another may lag.
Putting it in a Dollar Perspective
As a case study, we looked at how $10,000 would have grown in the 10 largest series at the end of 2012
over the next 10 years. Though this study does not account for sequencing of returns, it demonstrates
the potential dollar difference an investor could earn depending on which target-date strategy they
select. To emphasize how selecting a narrow peer group with a backward-looking perspective is not best
practice, we chose the 10 largest series at the end of 2012, which are not the same as at the end of
2022, demonstrating how cherry-picked peer groups modify over the years. One of 2012’s top 10 series,
Allspring Target funds, liquidated in 2022, and only four others—T. Rowe Price Retirement, American
Funds Target Date Retirement, Fidelity Freedom, and Fidelity Freedom Index—are still in the top 10
today (when including both mutual fund and CIT assets).
Target-Date Strategy Landscape: 2023 | See Important Disclosures at the end of this report.
Page 30 of 34
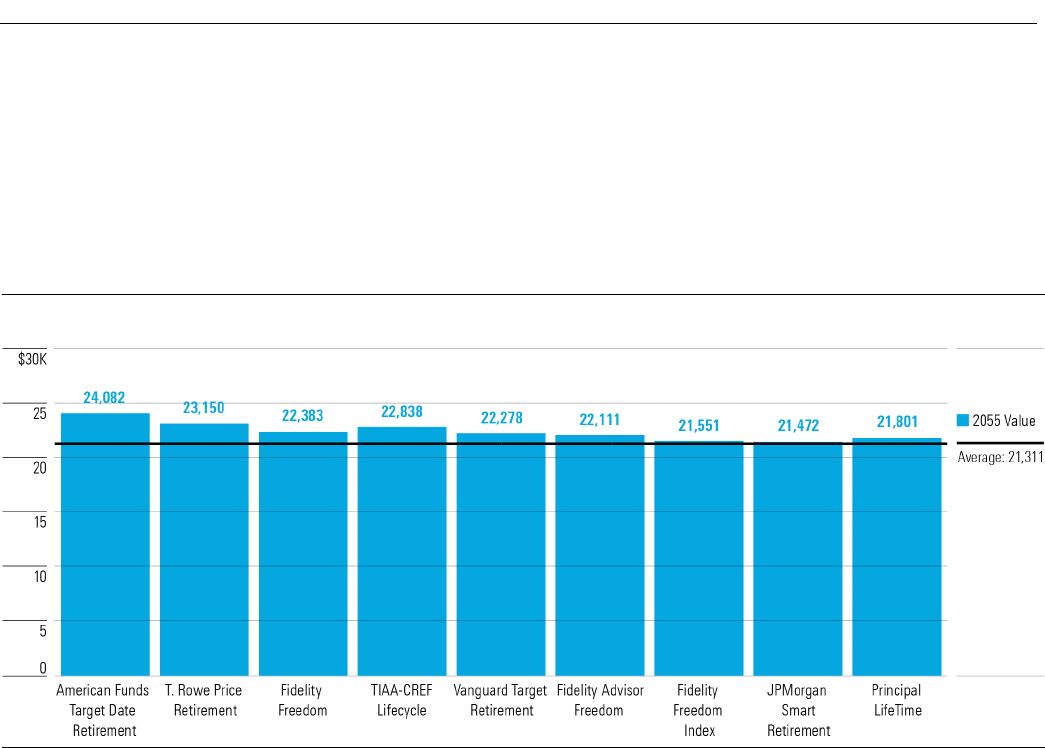
Starting with the 2055 vintage, American Funds Target Retirement earned the most for investors over
the past 10 years despite its challenging 2022 performance. Investors in T. Rowe Price Retirement series
gained almost $1,000 less over that time horizon. Both outpaced the average. Exhibit 28 compares the
ending balances of the nine existing series’ 2055 vintages with the category average’s balance.
Exhibit 28
2055 Vintage Growth of $10,000
Source: Morningstar Direct. Data as of 12/31/2022.
Target-Date Strategy Landscape: 2023 | See Important Disclosures at the end of this report.
Page 31 of 34
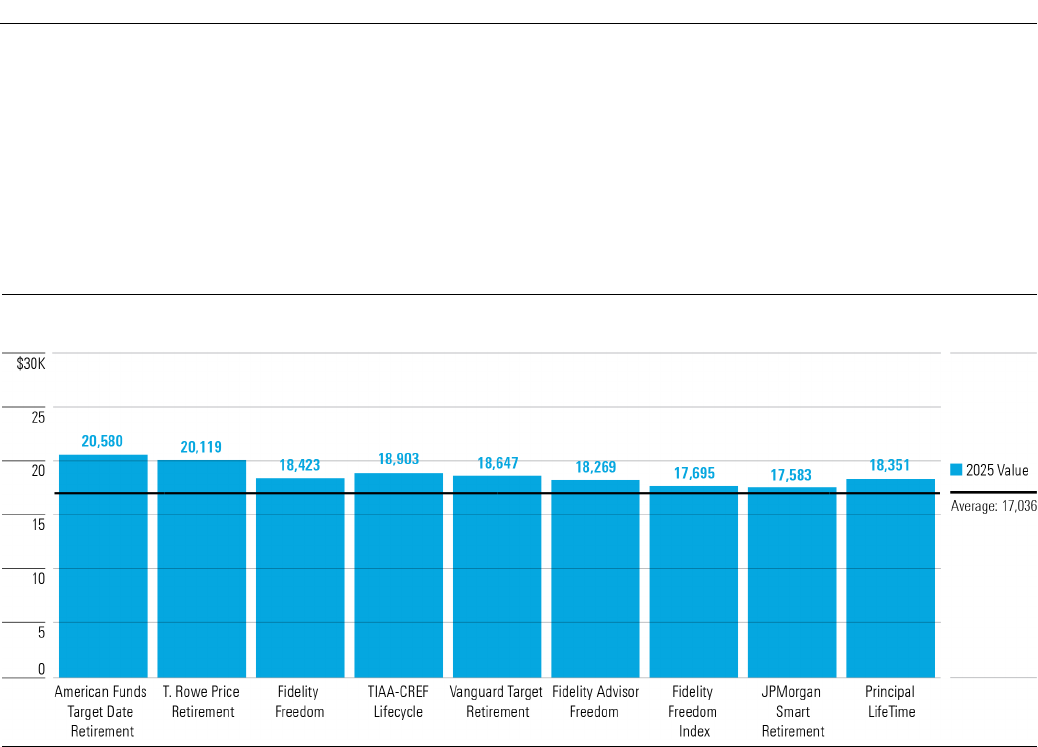
Looking at the other end of the glide path, near retirement, the target-date funds rank in the same order;
however, that is not always consistent across the industry. American Funds and T. Rowe Price still took
the top two spots, but the spread between best and worst was tighter. About $3,000 separated
American Funds Target Date Retirement from the last place JPMorgan SmartRetirement.
Exhibit 29
2025 Vintage Growth of $10,000
Source: Morningstar Direct. Data as of
12/31/2022.
Narrowing a peer group to those that are the largest isn’t best practice. Though plan sponsors could’ve
chosen any of these 10 at the end of 2012, there were a plethora of other series they might’ve chosen,
some that were worse off. As the industry continues to evolve, so has the largest series, measured by
assets. For example, JPMorgan SmartRetirement, Principal Lifetime, and Fidelity Advisor Freedom no
longer sit in the top-10-largest series. Instead, BlackRock LifePath Index, State Street Target Retirement,
JPMorgan SmartRetirement Blend, and Principal Lifetime Hybrid round out the top 10 at the end of
2022.
Historically, performance hasn’t always determined which series garners the most flows. For example,
Vanguard Target Retirement and Fidelity Freedom Index never top the performance charts here but
continue to garner flows for their low price tags and sensible broad market exposure. And the last
decade’s top performer, American Funds Target Date Retirement, is the fourth-largest series by assets.
As previous excessive-fee lawsuits continue to play a major role when plan sponsors select a target-date
series, the ramifications of this recent litigation can lead to performance-chasing and swapping out
target-date strategies more often than they should.

Target-Date Strategy Landscape: 2023 | See Important Disclosures at the end of this report.
Page 32 of 34
Will Sustainable Investing Make Waves in Target Dates?
Despite a dramatic slowdown in flows in 2022, sustainable funds and ESG investing continue to capture
investor interest and positive net flows. They have faced higher hurdles and lower adoption among
target dates, though. The evolving regulatory environment remains among their biggest challenges. In
2020, the Department of Labor’s ruling prevented intentional ESG strategies from serving as the
qualified default investment alternative, or QDIA, in defined-contribution plans. Plans typically use
target-date strategies to fill this QDIA role, so the ruling deterred providers from launching ESG-focused
target-date options. However, a 2022 DOL ruling superseded the 2020 changes, allowing ESG options to
be used as the QDIA and, in turn, broadening the opportunity for ESG target-date strategies. The debate
is far from over, and in March 2023, President Joe Biden vetoed a bill that would have effectively
reinstated the previous administration's ban on plan sponsors from considering ESG factors in retirement
plans.
The number of sustainable fixed-income funds has more than doubled since 2018, but many firms still
lack sufficient ESG-focused options with reasonable asset bases and track records to build out well-
diversified target-date strategies. The ESG criteria used to evaluate important fixed-income sectors, such
as U.S. and other government bonds and asset-backed securities, isn’t as robust or standardized as the
criteria used to evaluate corporate stocks and bonds.
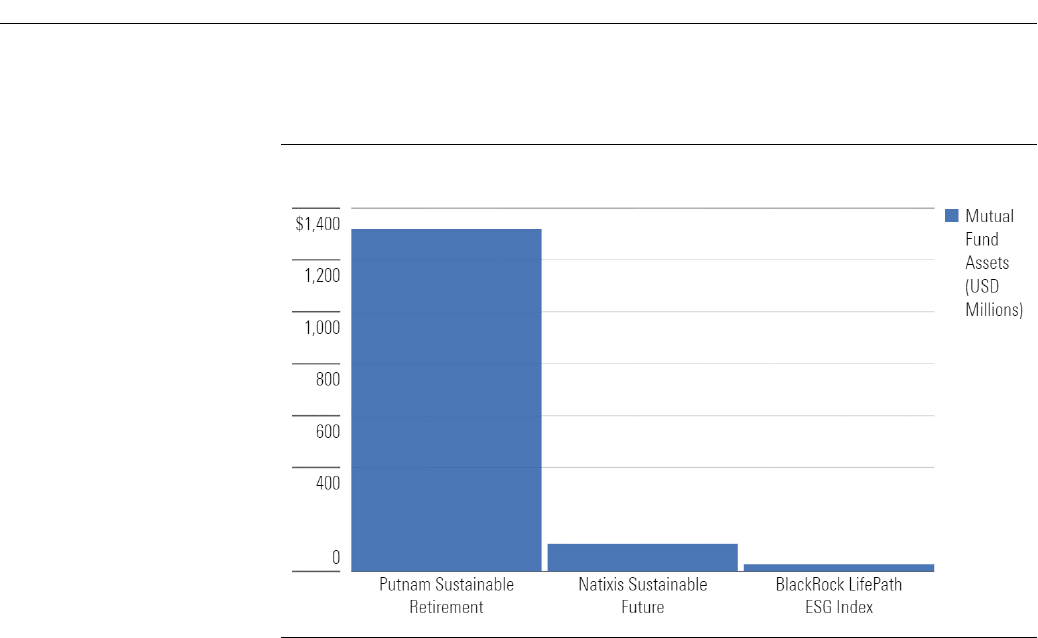
Some providers have tried to address the market, though. Natixis launched the first ESG target-date
strategy, Natixis Sustainable Future, in early 2017, and BlackRock opened BlackRock LifePath ESG Index
in 2020. So far, neither series has gained much traction. At the end of 2022, they had $105.5 million and
$28 million in assets, respectively.
Since the last DOL ruling, more providers have said they would launch sustainable target dates. In May
2022, Putnam announced it would convert its RetirementReady series to a sustainable-focused series in
February 2023. In anticipation of the series’ conversion, the firm launched five sustainable funds it
planned to use as the series' underlying holdings. Fidelity also filed a preliminary registration for a
sustainable target-date series in February 2023, along with four sustainable funds that will likely be held
by the series. Including recently launched funds with no track records in a target-date series is not a
best practice.
Putnam has a head start in garnering assets for its ESG series because it was a conversion rather than a
new launch, so its assets look inflated compared with the other two series, which have a longer track
record as ESG series. Exhibit 30 shows the three series’ assets as of the end of 2022. Note, at the time
the Putnam series had not converted to its sustainable mandate yet, but its head start made it the
largest ESG target-date series when it restructured.
Target-Date Strategy Landscape: 2023 | See Important Disclosures at the end of this report.
Page 33 of 34
Exhibit
30 ESG Target-Date Funds' Assets
Source: Morningstar Direct. Data as of
12/31/2022.
Regulatory changes and investor demand have spurred providers to consider launching more ESG-
friendly target-date options, but it remains to be seen if plan sponsors will adopt strategies.
K

Target-Date Strategy Landscape: 2023 | See Important Disclosures at the end of this report.
Page 34 of 34
About Morningstar Manager Research
Morningstar Manager Research provides independent, fundamental analysis on managed investment
strategies. Analyst views are expressed in the form of Morningstar Analyst Ratings, which are derived
through research of five key pillars—Process, Performance, Parent, People, and Price. A global research
team issues detailed Analyst Reports on strategies that span vehicle, asset class, and geography.
Analyst Ratings are subjective in nature and should not be used as the sole basis for investment
decisions. An Analyst Rating is an opinion, not a statement of fact, and is not intended to be nor is a
guarantee of future performance.
About Morningstar Manager Research Services
Morningstar Manager Research Services combines the firm's fund research reports, ratings, software,
tools, and proprietary data with access to Morningstar's manager research analysts. It complements
internal due-diligence functions for institutions such as banks, wealth managers, insurers, sovereign
wealth funds, pensions, endowments, and foundations. Morningstar’s manager research analysts are
employed by various wholly owned subsidiaries of Morningstar, Inc. including but not limited to
Morningstar Research Services LLC (USA), Morningstar UK Ltd, and Morningstar Australasia Pty Ltd.
?
22 West Washington Street
Chicago, IL 60602 USA
©2023 Morningstar. All Rights Reserved. Unless otherwise provided in a separate agreement, you may use this report only in the
country in which its original distributor is based. The information, data, analyses, and opinions presented herein do not constitute
investment advice; are provided solely for informational purposes and therefore are not an offer to buy or sell a security; and are
not warranted to be correct, complete, or accurate. The opinions expressed are as of the date written and are subject to change
without notice. Except as otherwise required by law, Morningstar shall not be responsible for any trading decisions, damages, or
other losses resulting from, or related to, the information, data, analyses, or opinions or their use. The information contained herein
is the proprietary property of Morningstar and may not be reproduced, in whole or in part, or used in any manner, without the prior
written consent of Morningstar. To license the research, call +1 312 696-6869.
