DOCUMENT °ESUME
ED 313 742
CS 506 947
AUTHOR
Corder, Lloyd E.
TITLE
Survey Report of Presentation Skills Training in
"Fortune 500" Industrial Companies.
PUB DATE
89
NOTE
16p.
PUB TYPE
Reports - Research/Technical (143) -- Statistical
Data (110)
EDRS PRICE
MF01/PC01 Plus Postage.
DESCRIPTORS
*Business Communication; Communication Skills; Group
Dynamics; *Interpersonal Communication; Occupational
Surveys; *Professional Training; Public Speaking;
Skill Development; *Training Methods; *Training
Objectives
IDENTIFIERS
*Fortune 500
ABSTRACT
A study surveyed current pre=c-tation skills training
practices of "Fortune 500" industrial companies. Each company's chief
executive officer was sent a cover letter explaining the study and a
copy of the survey. Data were obtained from 154 respondents (for a
36% response rate). Results indicated the importance of presentation
skills to job performance, and a majority of the companies (82%)
provide some kind of presentation skills training. Findings suggest
that most training courses are short, specific, and drill oriented,
and that they are evaluated in --me way at the conclusion of the
training. (Seventeen tables of data are included.) (KEH)
*****************************************************************.*****
*
Reproductions supplied by EDRS are the best that can be made
*
from the original document.
*
********4.*************A************************************************
Survey Report of
Presentation Skills Training
In Fortune 500 Industrial Companies
Lloyd E. Corder
Department of Communication
1117 Cathedral of Learning
University of Pittsburgh
Pittsburgh, Pennsylvania 15260
(412) 624-6567
Copyright ©1989
"PERMISSION TO REPRODUCE THIS
MATERIAL HAS BEEN GRANTED BY
L6itLELoizi.e2r_
2
TO THE EDUCATIONAL RESOURCES
INFORMATION CENTER (ERIC)."
U.S. DEPARTMENT OF EDUCATION
°Mee of Educational Research and Improvement
EDUCATIONAL RESOURCES INFORMATION
CENTER (ERIC)
0 This document has been reproduced as
received from the person or organizatt..x
onomating it.
0 Minor changes have been made to Improve
reproduction Quaid/
Points of view Of opinions stated in this docir
menl do net necessarily represent of
OERI position or policy.
Executive Summary
2
Definitions
4
Demographics of the Respondents
5
importance of Presentation Skills to Job Performance
6
Companies that Do Not Provide Training
7
Companies that Do Provide Training
8
In-House Training Programs
10
Evaluation Attempts of in-House Training Programs
13
el
Presentation Skills Training Survey Report
a
i
Executive Summary
Research studies over the past 50 years have overwhelmingly concluded that most
businesses want and need employees with strong presentation skills.
Unfortunately,
very few studies during this same period - -and no study since 1969--have tried to find
out what businesses do in the way of providing presentation skills training. Because so
little is known about such an important area, a survey was undertaken to determine cur-
rent presentation skills training practices of Fortune 500 industrial companies.
Each company's CEO was sent a cover letter explaining the study and a copy of the
survey. One month after this first mailing, a second cover letter and survey were sent to
the nonrespondents (N=400). A total of 180 surveys were received for a response rate
of 36% (154 completed surveys; 26 declined to participate).
Importance of Presentation Skills to Job Performance
Presentation
skills rank "very important" for the sales staff,
executives, middle
managers, and human resource staff; rank "important" for the supervisors ana technical
staff; and rank between "somewhat important" and "not important" for the secretarial
staff and hourly wage workers.
Further statistical tests showed that there is strong
agreement between the responses.
On one level, the results are not surprising. Some company positions (sales staff, ex-
ecutives, middle managers, and human resource staff) need presentation skills more
than others.
After all, employees in these positions are more likely to make presen-
tations.
On another level, the results somewhat contradict earlier research reports.
If presen-
tation skills are important to a company's success, why shouldn't the skills be important
for all levels of employees? One explanation may be that earlier studies did not attempt
a comparison of the importance of the skill and the level of employee.
Description of Training Practices
A majority of the companies (82%) provide some kind of presentation skills training.
This is a much higher number than current national estimates (36%)1 and suggests that
many of the top 500 companies think that presentation skills play an important part in
their success.
This conclusion gains even more support when examining the three
main reasons why this training was implemented: 1) to increase employee performance,
2) employees wanted it, and 3) it's part of employees' general training.
1Lee, C. (October, 1987). Where the training dollars go. Training, 24(10), 51-65.
Presentation-Skills Training Survey Repori
4
2
Who performs the training? For the highest levels of employees (executives and middle
managers), outside consultants usually provide the training.
For all others, the most
likely source is the in-house staff, although vendor companies are a close second.
Finally, more training is provided for the higher level employees, while relatively little
training is provided for the hourly wage workers. These results correspond directly with
the "perceived importance" of presentation skills for each level of employee. Essen-
tiaily, the more important the skills are for an employee's performance, the more likely
that employee is to receive training.
Analysis of In-House Training Efforts
Although training comes from several sources, 73% of the companies provide training
that is delivered by in-house staffs.
The average class size is 13 employees, the
average length of the training is 7 hours for 3 days, and the course is offered about 9
times per year.
As far as the content of the training is concerned, the training usually focuses on or-
ganization techniques, use of visual aids, physical delivery, handling speaking fear, vo-
cal delivery, handling questions, and gaining audience attention.
The most popular
training aids are videotape, lectures, group participation exercises, material developed
in-house, and structured discussions.
These findings suggest that most of the courses are short, specific, and drill oriented
(use actual speaking practice). They seem to vary from the standard university course
in length of training, depth of the material, and amount of practice devoted to delivering
presentations.
Evaluation Attempts of In-House Training Programs
Of the in-house programs, 89% are evaluated in some way, usually at the conclusion of
the training. The type of evaluation conducted is most frequently that of "reaction" or
"how well the participants liked the program."
More detailed evaluations, such as
"results" or "how the program reduced costs, improved quality, or improved quantity,"
are attempted much less frequently.
Who sees the reports of the evaluations?
Usually the training directors and presen-
tation skills trainers. How are the evaluations used? To change the program.
.
These results, on one hand, are encouraging. Literature over the past 10 yeas has as-
serted that few programs are evaluated. Obviously, this isn't the case in this study. On
the other hand, the type of evaluation conducted is still relatively "low level." Strong at-
tempts to show that the programs are having a posiZ:ve dollar impact are still lacking.
The implication: when you can't prove that you are making or saving money, it is much
easier for your program to be terminated.
Presentation Skills Training Survey Report
3
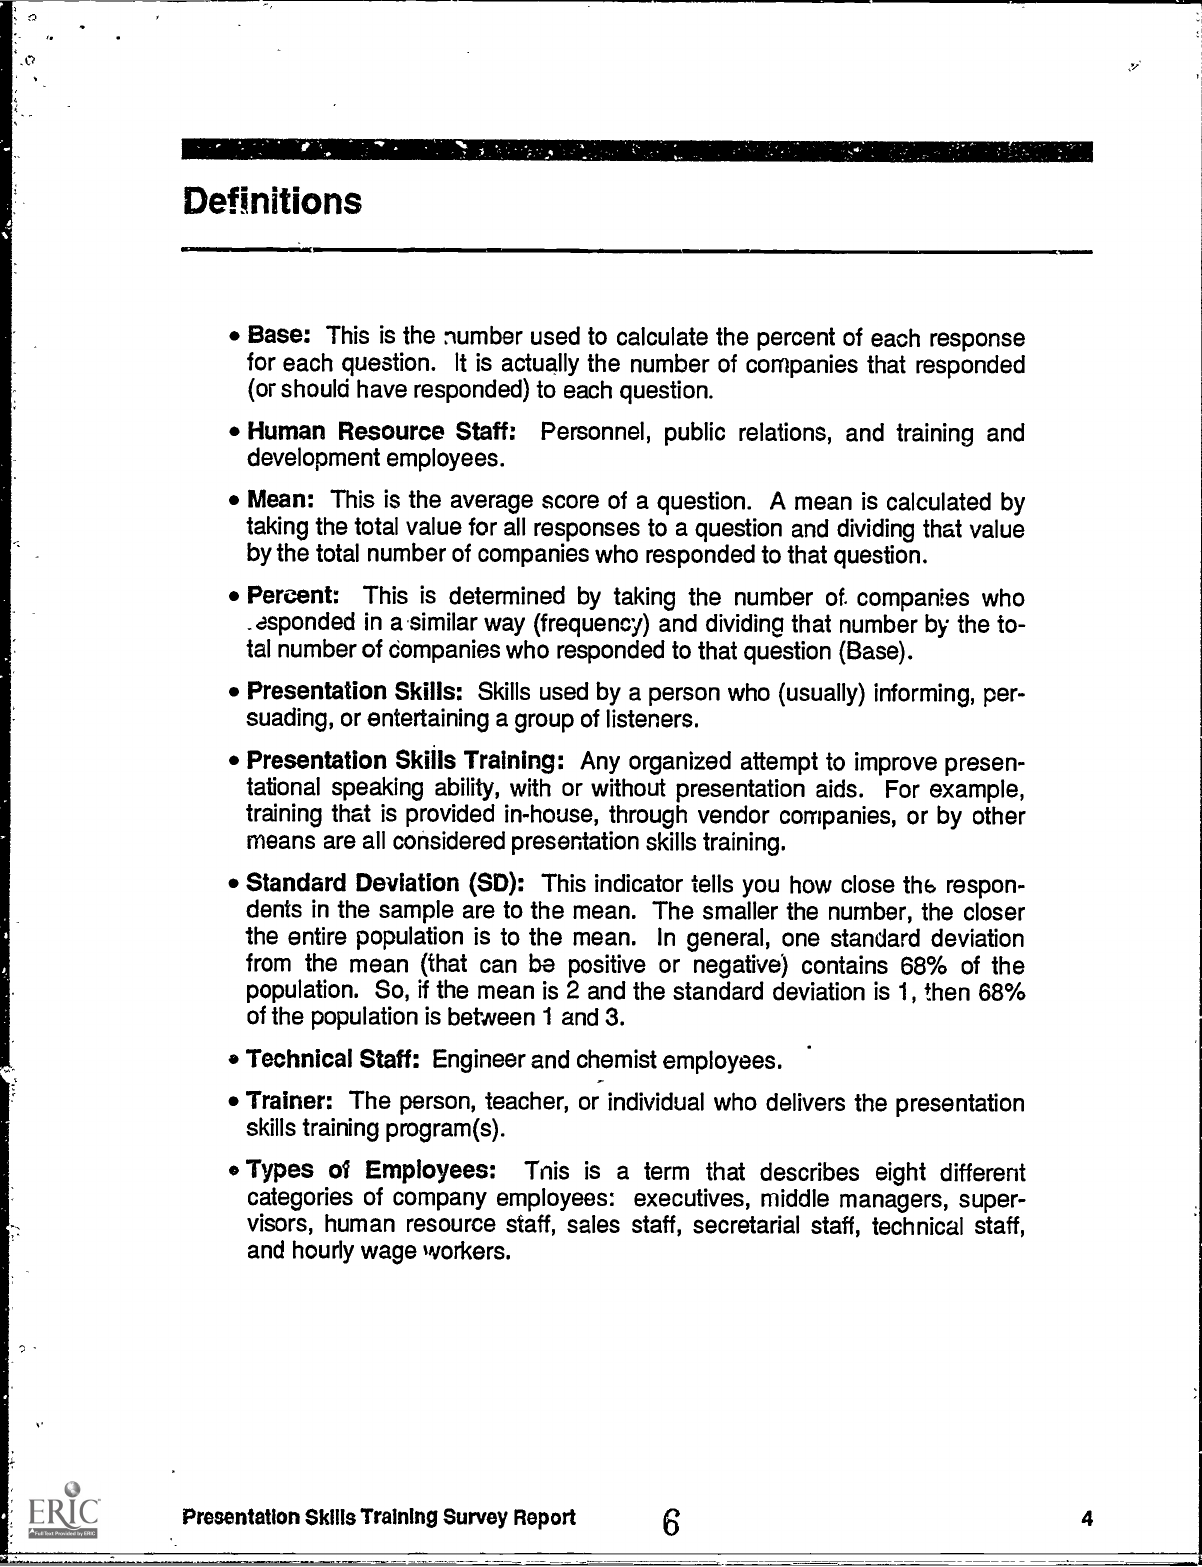
Definitions
Base: This is the number used to calculate the percent of each response
for each question.
It is actually the number of companies that responded
(or should have responded) to each question.
Human Resource Staff:
Personnel, public relations, and training and
development employees.
Mean: This is the average score of a question. A mean is calculated by
taking the total value for all responses to a question and dividing that value
by the total number of companies who responded to that question.
Percent:
This is determined by taking the number of. companies who
.
asponded in a 'similar way (frequency) and dividing that number by the to-
tal number of companies who responded to that question (Base).
Presentation Skills: Skills used by a person who (usually) informing, per-
suading, or entertaining a group of listeners.
Presentation Skills Training: Any organized attempt to improve presen-
tational speaking ability, with or without presentation aids.
For example,
training that is provided in-house, through vendor companies, or by other
means are all considered presentation skills training.
Standard Deviation (SD): This indicator tells you how close th6 respon-
dents in the sample are to the mean. The smaller the number, the closer
the entire population is to the mean.
In general, one standard deviation
from the mean (that can be positive or negative) contains 68% of the
population. So, if the mean is 2 and the standard deviation is 1, then 68%
of the population is between 1 and 3.
Technical Staff: Engineer and chemist employees.
Trainer: The person, teacher, or individual who delivers the presentation
skills training program(s).
Types of Employees:
This is a term that describes eight different
categories of company employees: executives, middle managers, super-
visors, human resource staff, sales staff, secretarial staff, technical staff,
and hourly wage workers.
Presentation Skills Training Survey Report
4
Inammimemimummarammurisontumwm
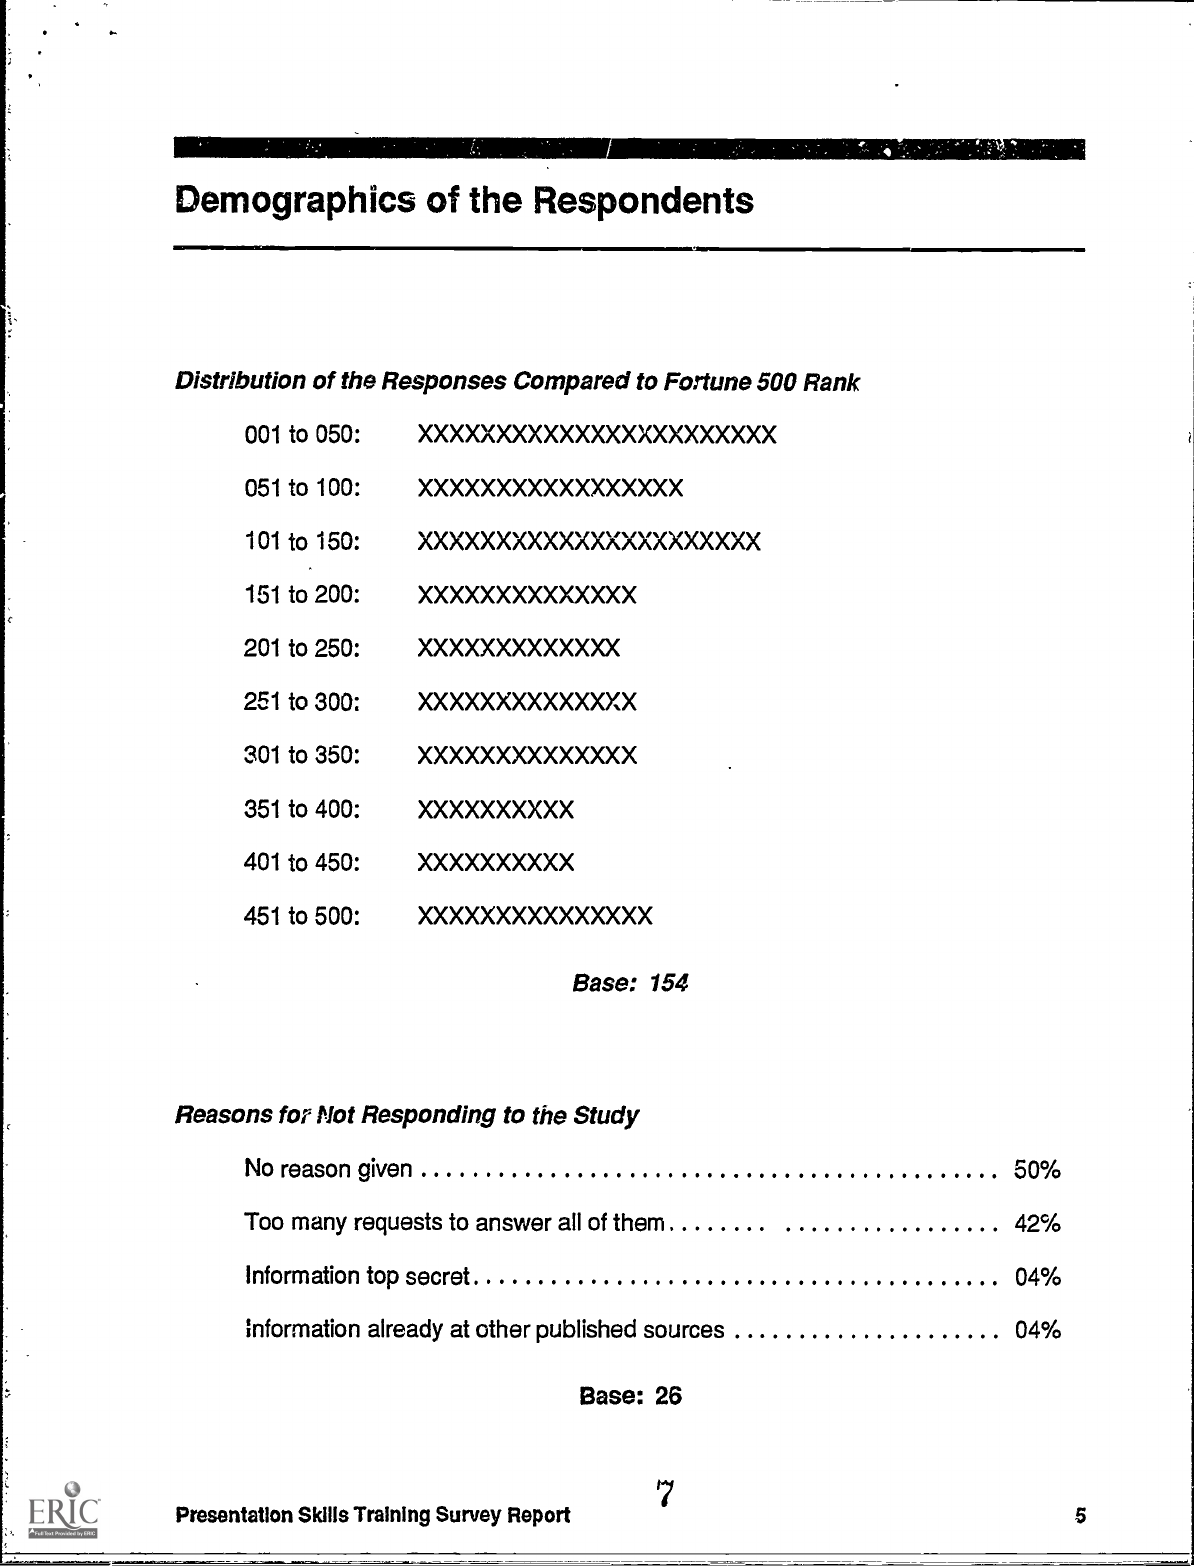
Demographics of the Respondents
Distribution of the Responses Compared to Fortune 500 Rank
001 to 050:
XXXXXXXXXXXXXXXXXXXXXXX
051 to 100: XXXXXXXXXXXXXXXXX
101 to 150:
XXXXXXXXXXXXXXXXXXXXXX
151 to 200: XXXXXXXXXXXXXX
201 to 250: XXXXXXXXXXXXX
251 to 300: XXXXXXXXXXXXXX
301 to 350: XXXXXXXXXXXXXX
351 to 400:
XXXXXXXXXX
401 to 450: XXXXXXXXXX
451 to 500: XXXXXXXXXXXXXXX
Base: 154
Reasons for Not Responding to the Study
No reason given
50%
Too many requests to answer all of them
42%
Information top secret
04%
Information already at other published sources
04%
Presentation Skills Training Survey Report
Base: 26
7
5
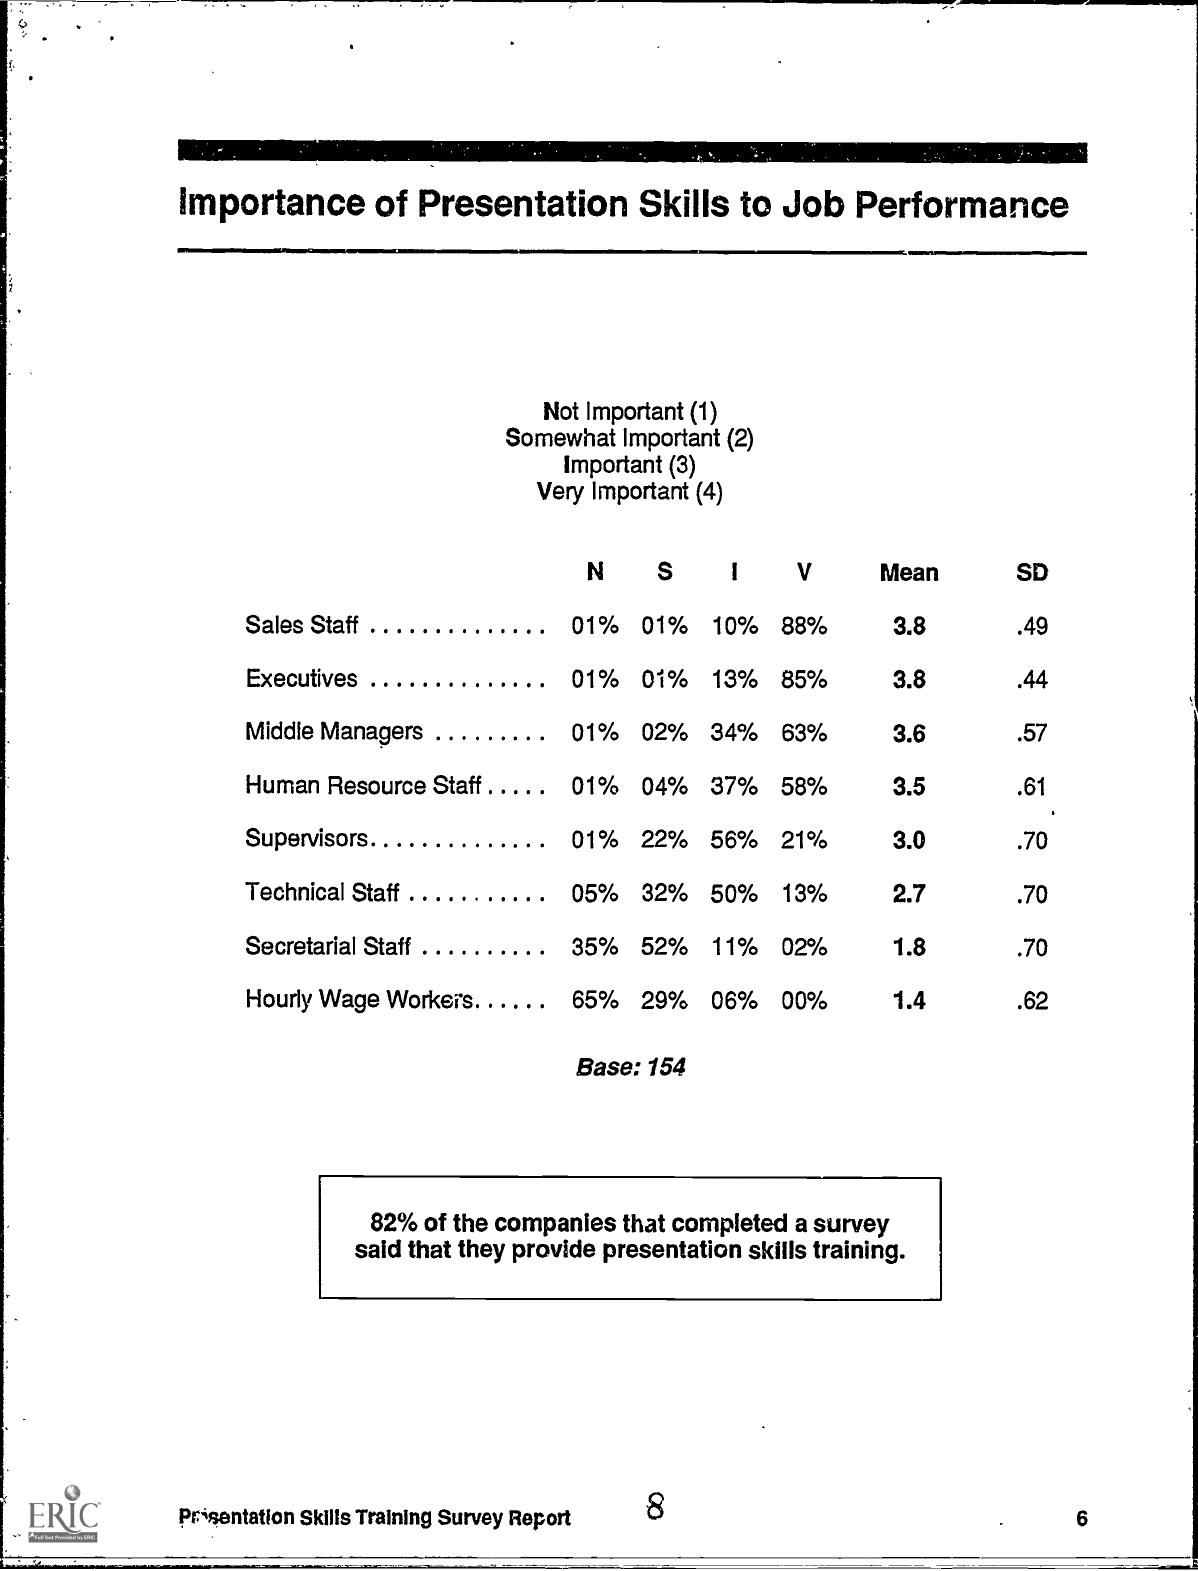
Importance of Presentation Skills to Job Performance
Not Important (1)
Somewhat Important (2)
Important (3)
Very Important (4)
NS
I V
Mean
SD
Sales Staff
01% 01% 10% 88%
3.8 .49
Executives
01%
01% 13% 85%
3.8 .44
Middle Managers
01%
02% 34%
63%
3.6
.57
Human Resource Staff
01% 04% 37% 58%
3.5 .61.
Supervisors
01%
22% 56% 21%
3.0 .70
Technical Staff
05% 32% 50%
13% 2.7
.70
Secretarial Staff
35% 52% 11% 02%
1.8 .70
Hourly Wage Workers
65% 29%
06% 00%
1.4 .62
Base: 154
82% of the companies that completed a survey
said that they provide presentation skills training.
prisentation Skills Training Survey Report
8
6
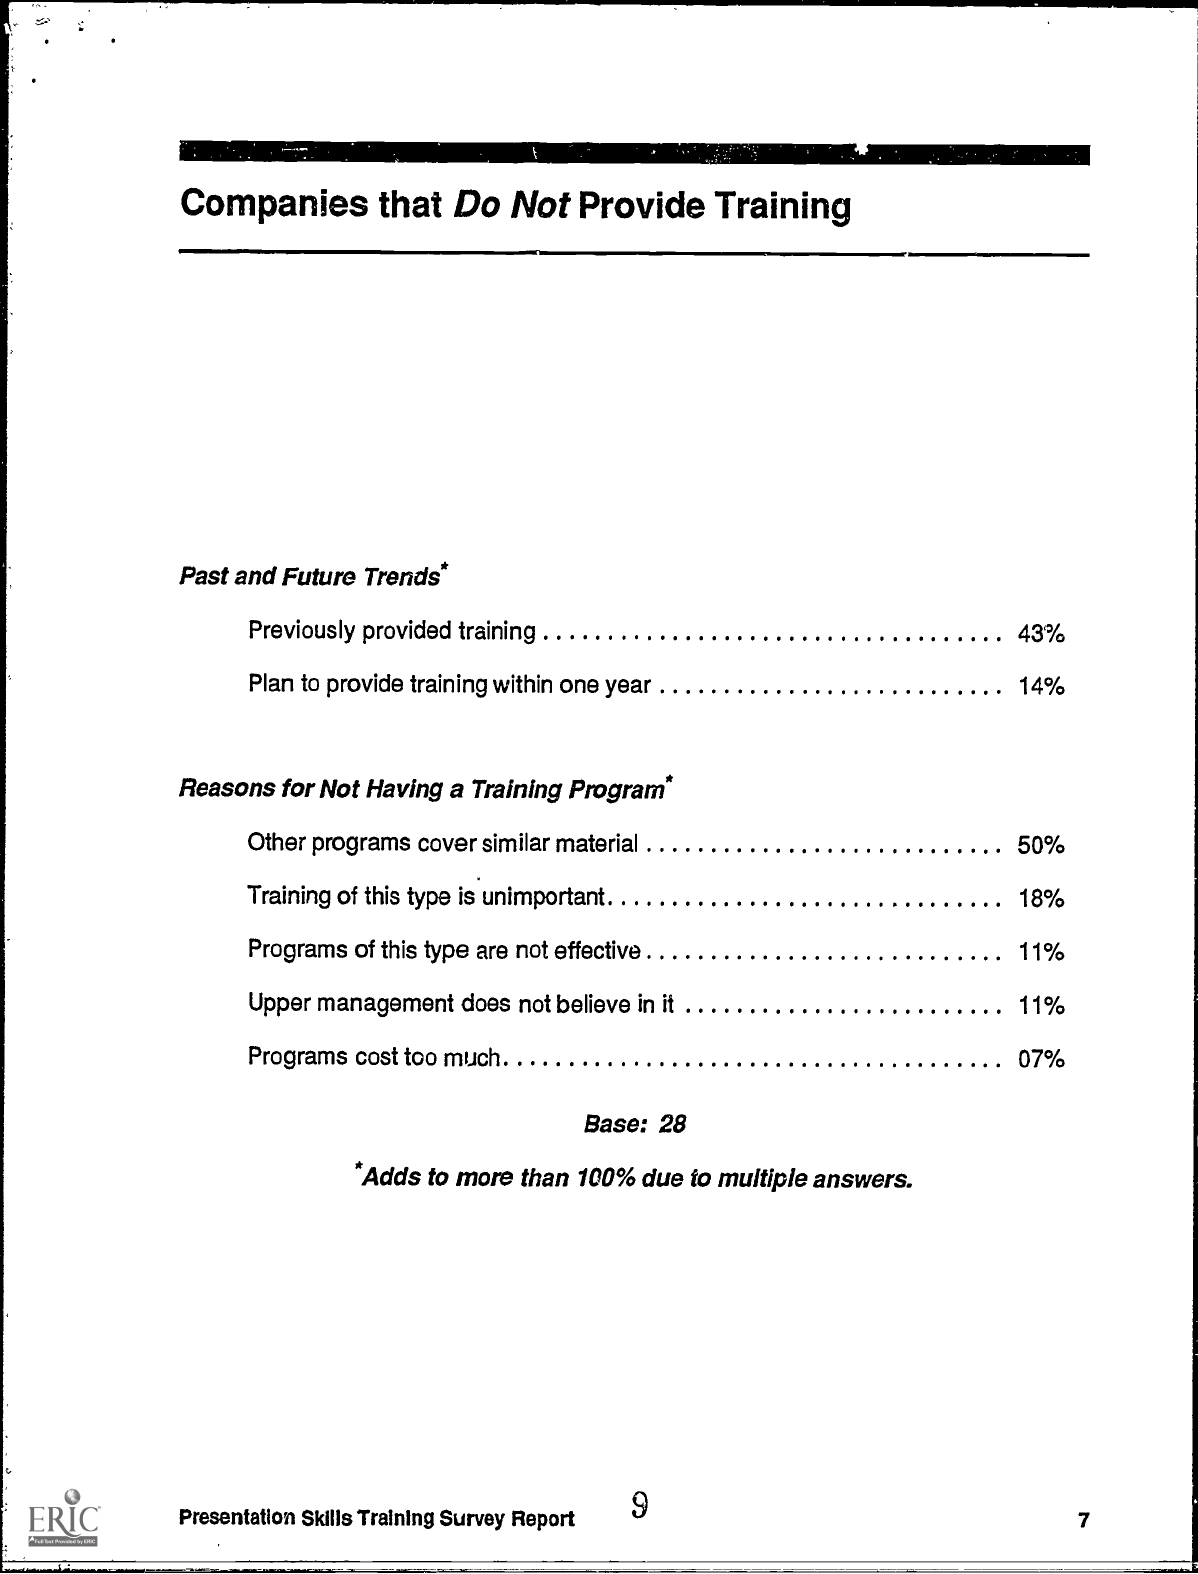
Companies that Do Not Provide Training
Past and Future Trends*
Previously provided training
43%
Plan to provide training within one year
14%
Reasons for Not Having a Training Program*
Other programs cover similar material
50%
Training of this type is unimportant
18%
Programs of this type are not effective
11%
Upper management does not believe in it
11c/0
Programs cost too much
07%
Base: 28
*Adds to more than 100% due to multiple
answers.
Presentation Skills Training Survey Report
9
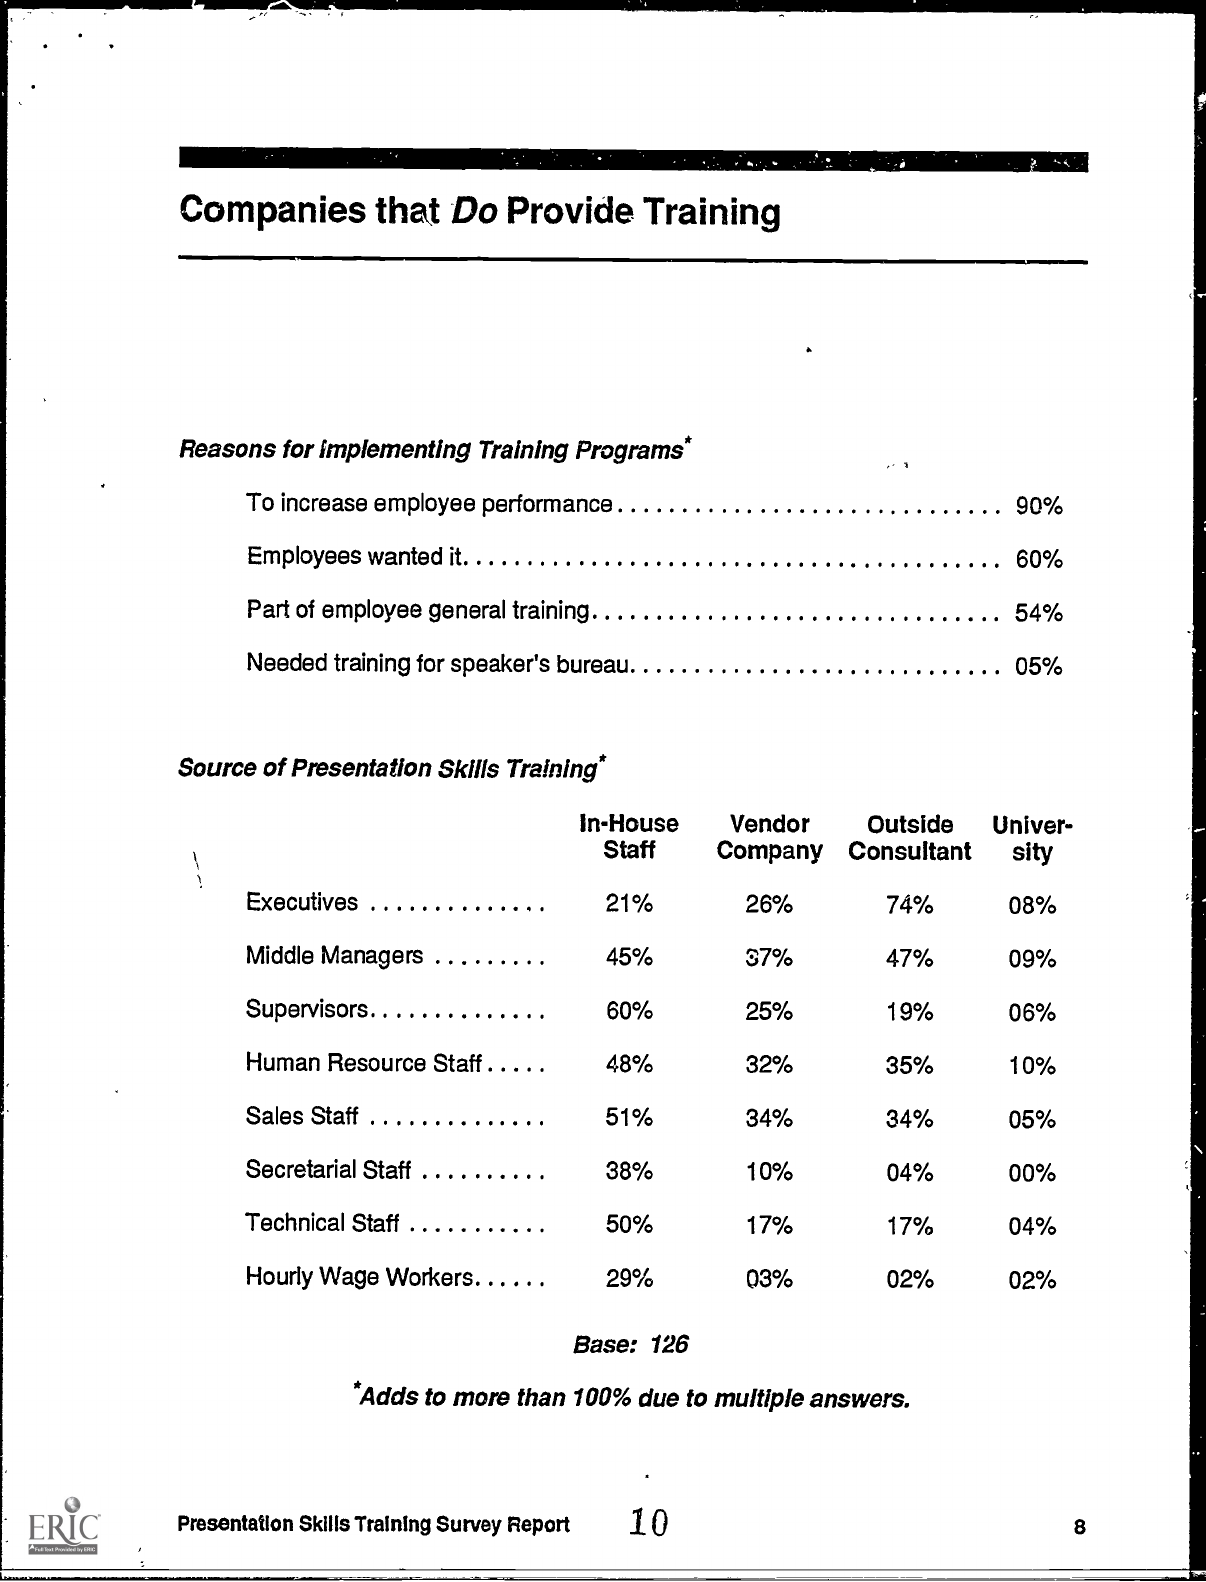
Companies that Do Provide Training
Reasons for implementing Training Program?
To increase employee performance
90%
Employees wanted it
60%
Part of employee general training
54%
Needed training for speaker's bureau
05%
Source of Presentation Skills Training*
In-House
Staff
Vendor
Company
Outside
Univer-
Consultant
sity
Executives
21%
26%
74% 08%
Middle Managers
45%
37%
47% 09%
Supervisors
60%
25%
19% 06%
Human Resource Staff
48%
32%
35%
10%
Sales Staff
51%
34%
34%
05%
Secretarial Staff
38%
10%
04%
00%
Technical Staff
50%
17%
17% 04%
Hourly Wage Workers
29%
03%
02%
02%
Base: 126
*Adds to more than 100% due to multiple
answers.
Presentation Skills Training Survey Report
10
8
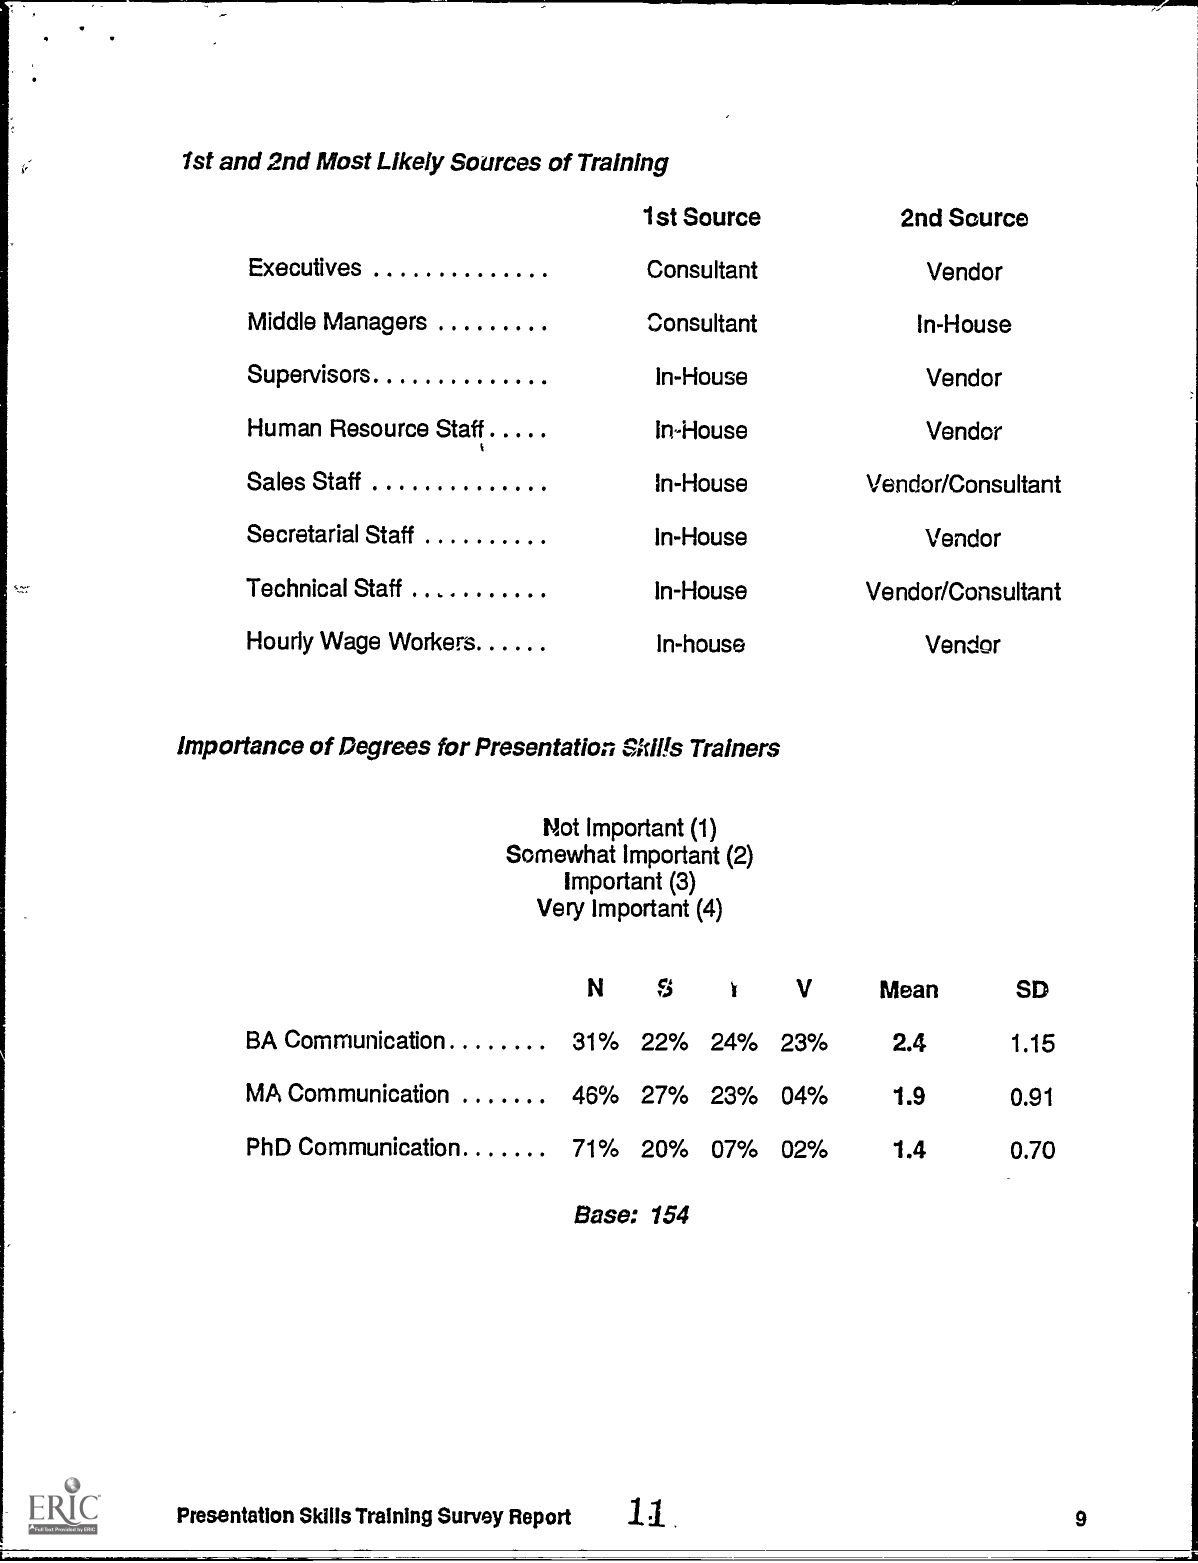
1st and 2nd Most Likely Sources of Training
1st Source
Executives
Consultant
Middle Managers
Consultant
Supervisors
In-House
Human Resource Staff
In-House
Sales Staff
in -House
Secretarial Staff
In-House
Technical Staff
In-House
Hourly Wage Workers
In-house
Importance of Degrees for Presentation Skills Trainers
Not Important (1)
Somewhat Important (2)
Important (3)
Very Important (4)
2nd Source
Vendor
In-House
Vendor
Vendor
Vendor/Consultant
Vendor
Vendor/Consultant
Vendor
N
c4
..) r
V
Mean
SD
BA Communication
31%
22%
24%
23% 2.4
1.15
MA Communication
46% 27%
23%
04%
1.9
0.91
PhD Communication
71%
20%
07% 02%
1.4
0.70
Base: 154
Presentation Skills Training Survey Report
11.
9
6
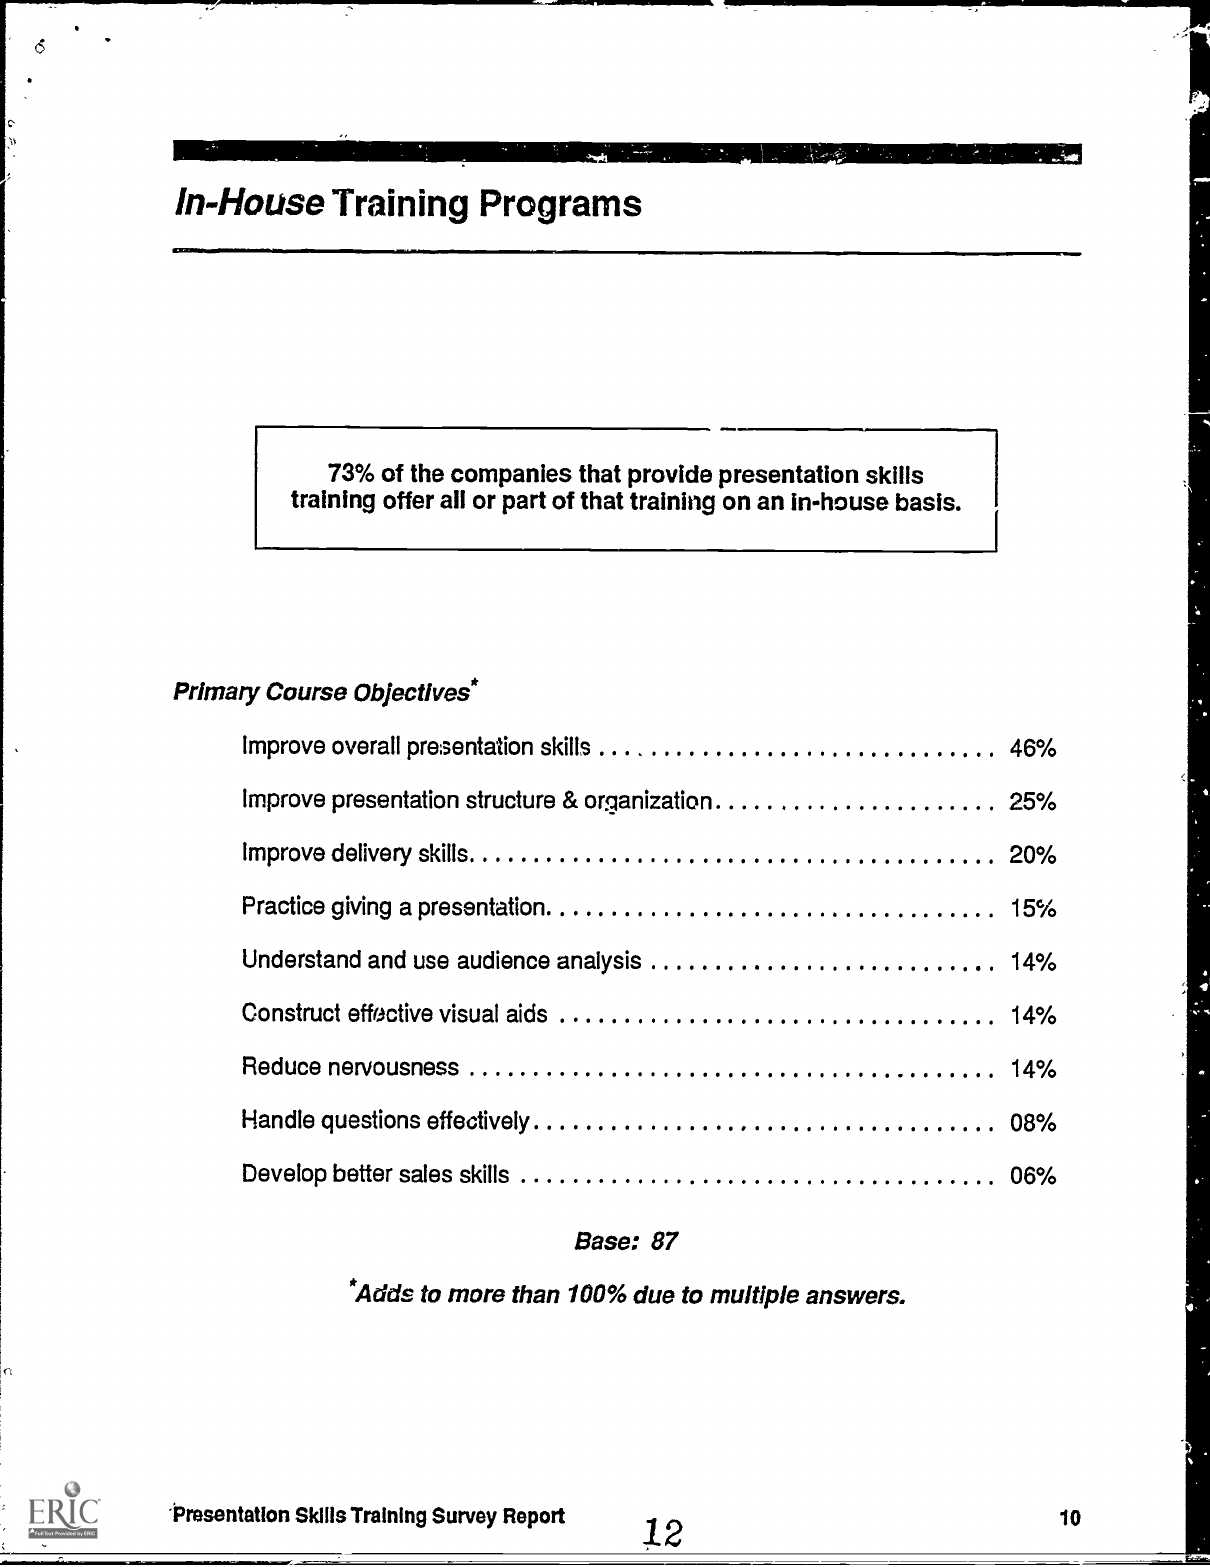
In-House Training Programs
73% of the companies that provide presentation skills
training offer all or part of that training on an in-house basis.
Primary Course Objectives*
Improve overall presentation skills
46%
Improve presentation structure & organization
25%
Improve delivery skills
20%
Practice giving a presentation
15%
Understand and use audience analysis
14%
Construct effective visual aids
14%
Reduce nervousness
14%
Handle questions effectively
08%
Develop better sales skills
06%
Base: 87
*Adds to more than 100% due to multiple
answers.
-Presentation Skills Training Survey Report
,t
10
2
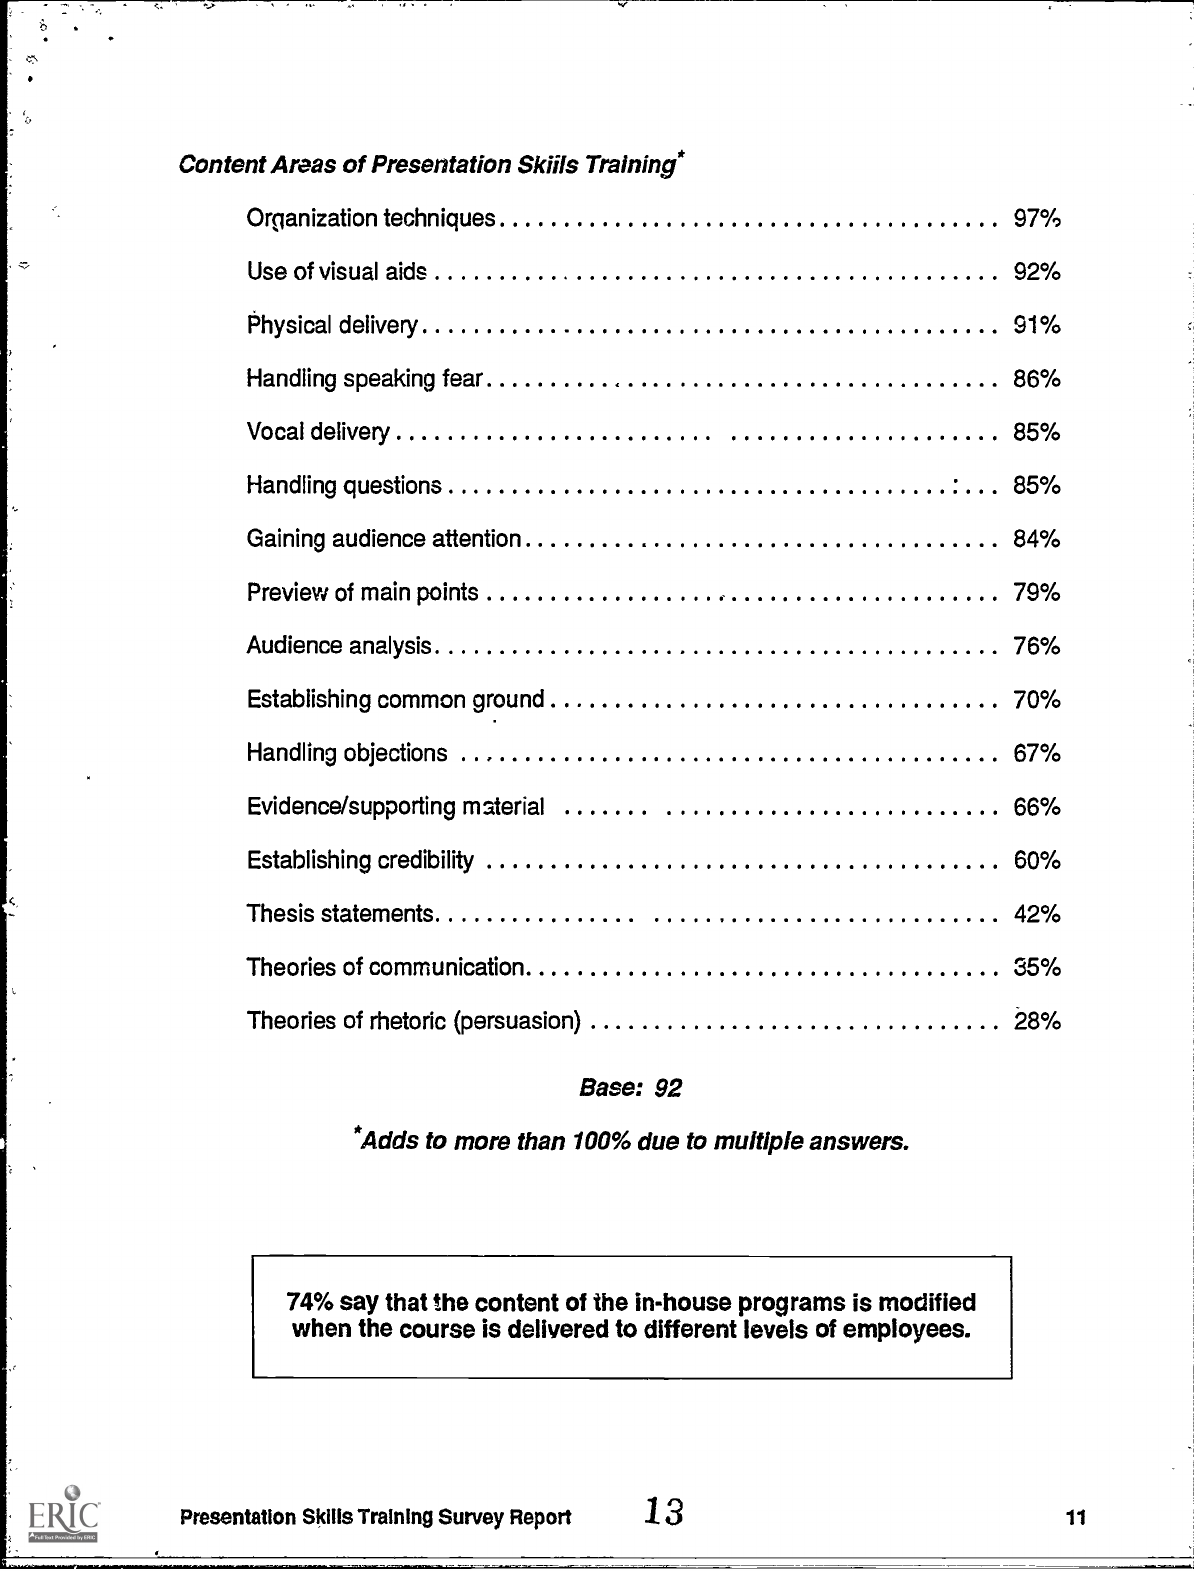
Content Areas of Presentation Skills Training*
Organization techniques
97%
Use of visual aids 92%
Physical delivery 91%
Handling speaking fear
86%
Vocal delivery
85%
Handling questions
85%
Gaining audience attention
84%
Preview of main points
79%
Audience analysis
76%
Establishing common ground
70%
Handling objections
67%
Evidence/supporting material
66%
Establishing credibility
60%
Thesis statements
42%
Theories of communication
35%
Theories of rhetoric (persuasion)
28%
Base: 92
*Adds to more than 100% due to multiple answers.
74% say that the content of the in-house programs is modified
when the course is delivered to different levels of employees.
Presentation Skills Training Survey Report
.13 11
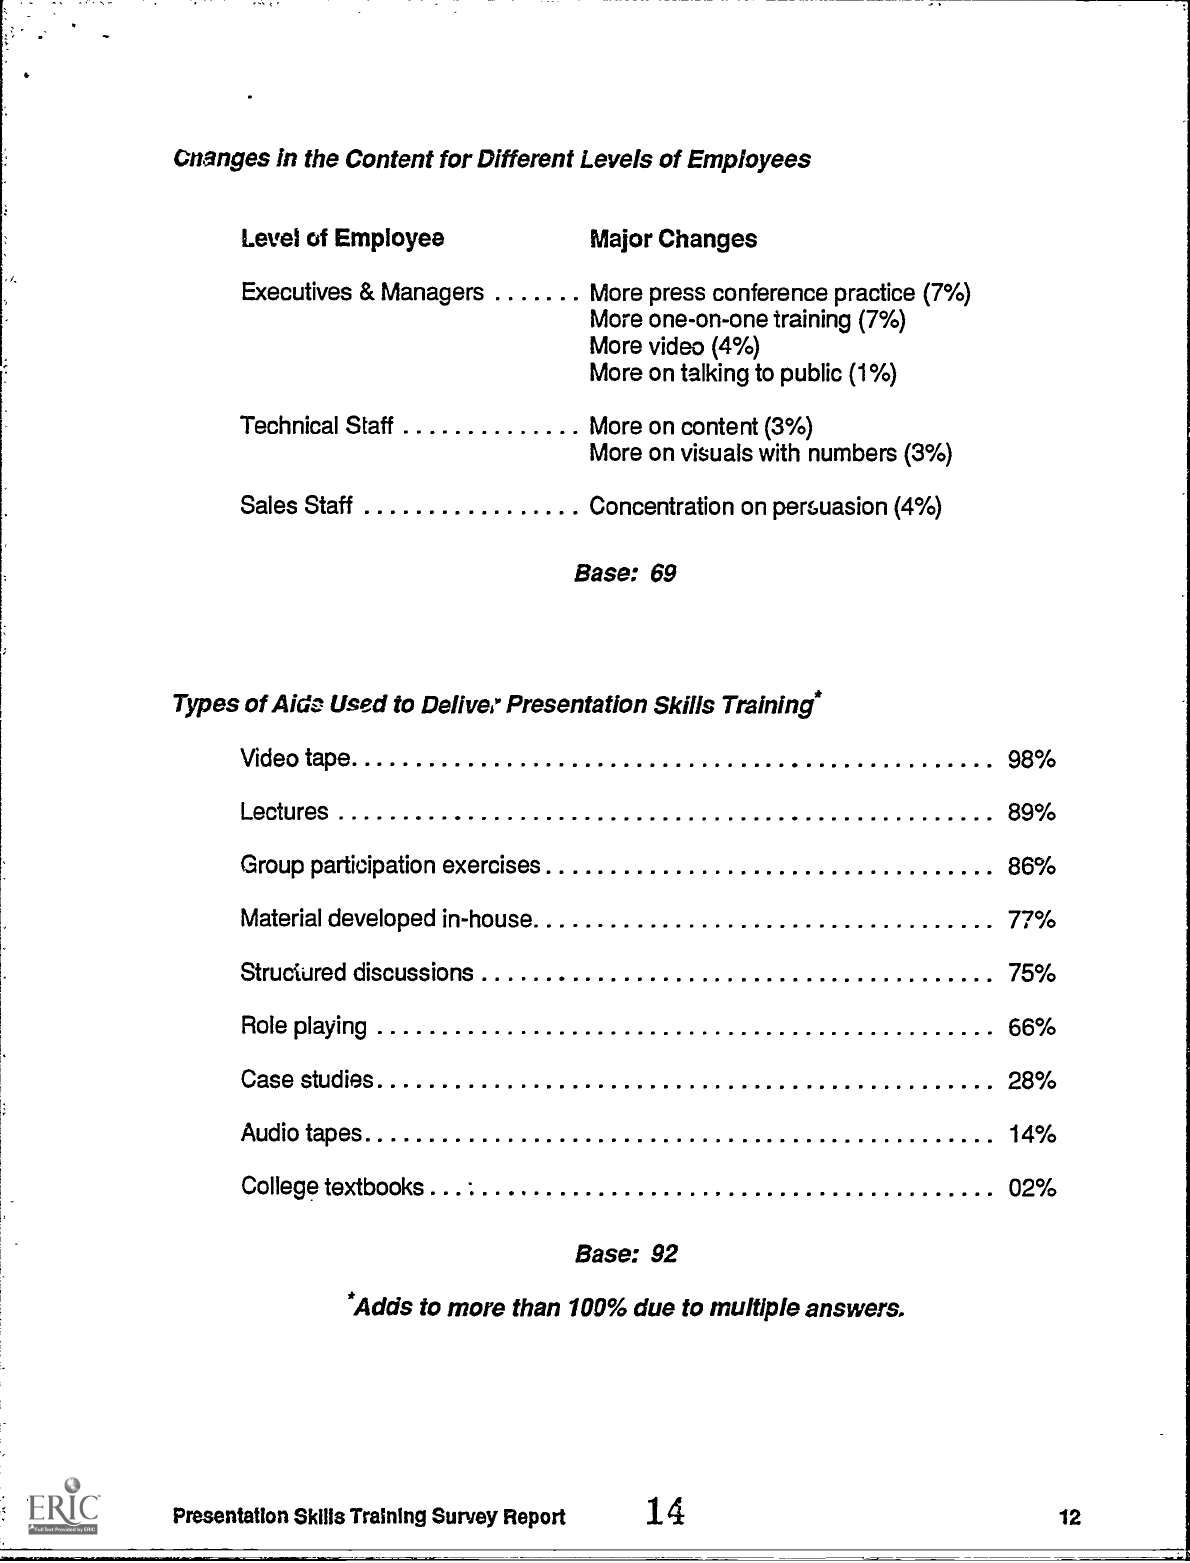
Cnanges in the Content for Different Levels of Employees
Level of Employee
Major Changes
Executives & Managers
More press conference practice (7%)
More one-on-one training (7%)
More video (4%)
More on talking to public (1%)
Technical Staff
More on content (3%)
More on visuals with numbers (3%)
Sales Staff
Concentration on persuasion (4%)
Base: 69
Types of Aide Used to Deliver Presentation Skills Training*
Video tape
98%
Lectures
89%
Group participation exercises
86%
Material developed in-house
77%
Structured discussions
75%
Role playing
66%
Case studies
28%
Audio tapes
14%
College textbooks
02%
Base: 92
*Adds to more than 100% due to multiple answers,
Presentation Skills Training Survey Report 14
12
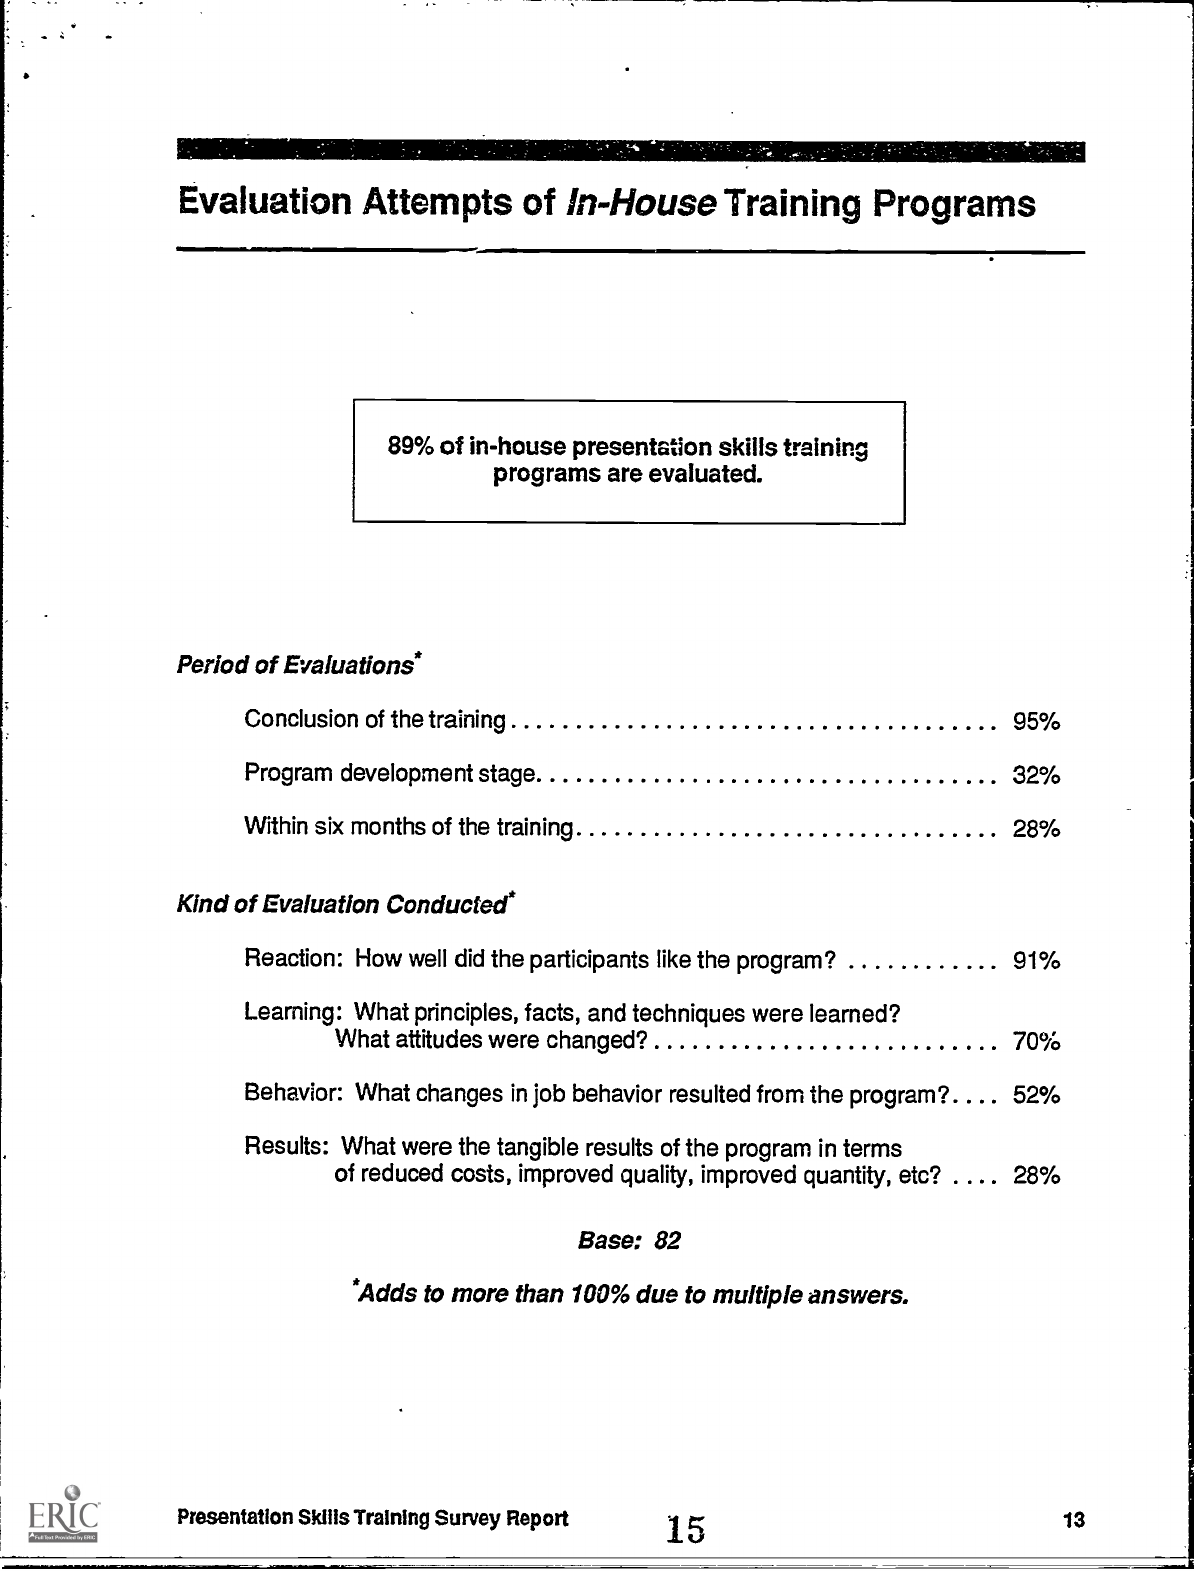
Evaluation Attempts of in-House Training Programs
89% of in-house presentation skills training
programs are evaluated.
Period of Evaluations*
Conclusion of the training
95%
Program development stage
32%
Within six months of the training
28%
Kind of Evaluation Conducted*
Reaction: How well did the participants like the program?
91%
Learning: What principles, facts, and techniques were learned?
What attitudes were changed"
70%
Behavior: What changes in job behavior resulted from the program"
52%
Results: What were the tangible results of the program in terms
of reduced costs, improved quality, improved quantity, etc?
.
28%
Base: 82
*Adds to more than 100% due to multiple
answers.
Presentation Skills Training Survey Report
15
13
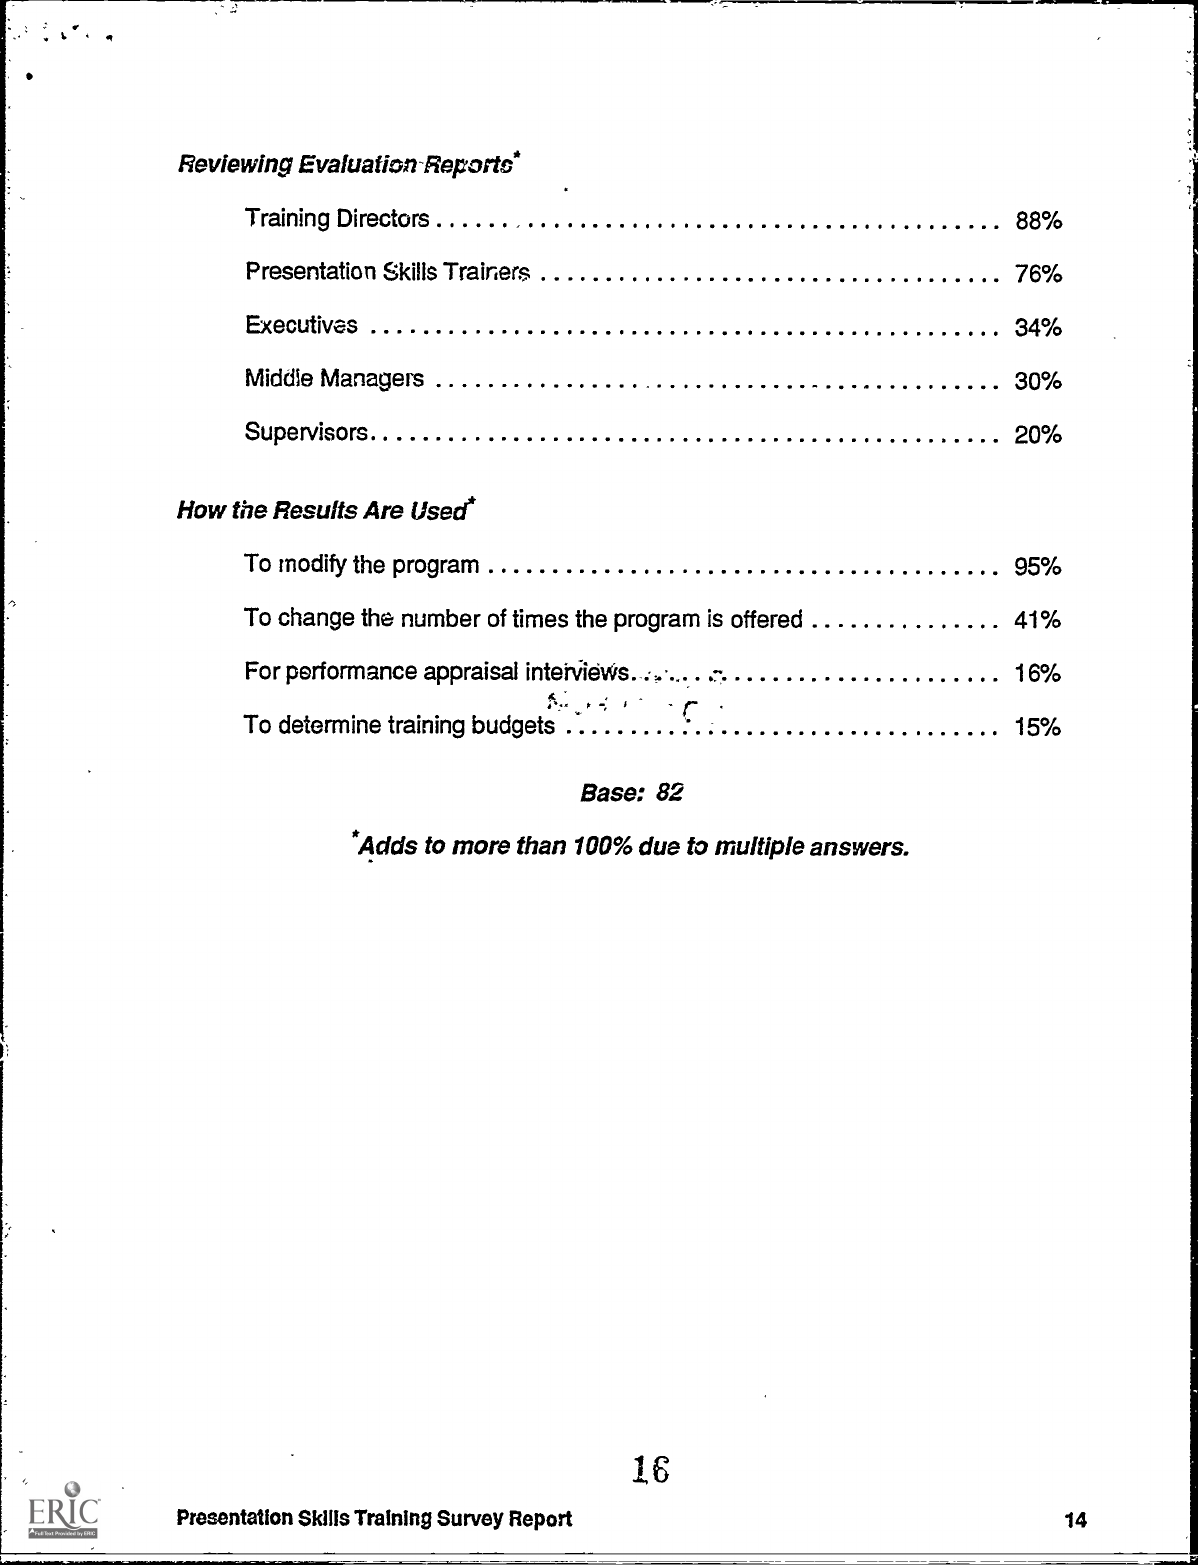
Reviewing Evaluation-Reports*
Training Directors
88%
Presentation Skills Trainers
76%
Executives
34%
Middle Managers
30%
Supervisors
20%
How the Results Are Used*
To modify the program
95%
To change the number of times the program is offered
41%
For performance appraisal interviews.
.
16%
4
To determine training budgets
15%
Base: 82
*Adds to more than 100% due to multiple
answers.
16
Presentation Skills Training Survey Report
14
