
LEVERAGING SCIENCE,DEVELOPING INNOVATION
CharacteristicsofDepreciation
inCommercialandMulti‐FamilyProperty:
AnInvestmentPerspective
By:
Sheharyar Bokhari &DavidGeltner
MITCenterforRealEstate
Thisversion:March,2014
PresentationPreparedforthe
PensionRealEstateAssociation
SpringMeeting,Boston,May14,2014

Depreciationfroman“InvestmentPerspective”…
“Depreciation”=“Long ‐termpermanentdeclineinpropertyvaluenetofgeneral
inflation,associatedwithbuildingage,causedbystructureobsolescenceevenafter
expenditureonroutinecapitalmaintenance.”
“Obsolescence”=“Physical”,“Functional”,or“Economic”…
“InvestorPerspective”=“Fundamentalimpactofdepreciationoninvestment
performance”
Economic(notaccrualaccounting)perspective
Focusedoncashflows&marketvalues(not“bookvalues”)
CompatiblewithIRRorHPRmetricsofinvestmentperformance
Declinerelativetopropertyvalue notjust
structurevalue
(though attributabletostructureobsolescence)
Notsameastaxpolicyperspective(thoughrelated).
Studyfeatures:
Largermorecomprehensivedatabase:73,229obs 2001‐13,
sales>$2.5M,fromRCAdatabaseof investmentproperties.
Basedonactualtransactionpricesnotappraisalsorassessments.
NOIeff ectvs“capratecreep”effect.
Causeofdifferencesacross
metros.

Whydoesdepreciationmatter?...
• Affectsthecapitalreturn(hencetotalreturn)ofCREinvestment
• RealdepreciationisubiquitousinCREinvestmentproperty,anditisnon ‐
trivial(Wefindcloseto150bps/yr includingland value ≈25%assetval).
• Butitisoftenignoredinmicro‐levelDCFvaluationanalysisofinvestment
property:
• Typical
pro‐formaautomaticallyprojectsrentalgrowthof“3%”,
vaguelybasingthatoninflation(eventhoughactualinflationis
probablylessthan3%),notrecognizingthatrealdepreciationmeans
thatrentsarelikelytogrowlessthaninflation.(Theoffsetisthe
typicalproforma appliesadiscountratethatisunrealisticallyhigher
than
actualexpectedIRR.)
• Andrealdeprecationhas“characteristics.”Itvariesacross:
• Metromarkets(relatedtospacemkt supply elasticity)
• Typesofproperties
• Ageofthebuiltstructureontheproperty
• Propertymarketconditions
• So,depreciationisimportantforinvestorstounderstand…

Measuredepreciationby“usedassetvintageprice”method:
Usehedonicregressionmodel:
Ln(Price/SF)=f(PropertyAttributes,TransactionInfo,LocationControls,Time
Dummies)
• PropertyAttributes=PropertyType,LnSqft,Age,Age
2
,cbd_fg
• TransactionInfo=SellerType,resolveddistress_fg,cmbs_fg,leaseback_fg,
excess_land_potential_fg
• LocationControls=RCAMetroAreadummyvariables
InthisspecificationAge&Age^2coefficientscapture
essentiallycross‐sectional variationinpriceasafunctionof
buildingage,i.e.,ageasofagiventime(timeofsale).E.g.,How
muchless30‐yr‐oldBldg Asellsforcomparedtootherwise
identical20‐yr‐oldBldg Basofthesamepointintime.Hence:
“real”(netofinflation)depreciation.
Alsonote:thisisdepreciationnet ofroutinecapital
expendituresontheproperties(whicharenotcontrolledfor).

Similarhedonicmodelofcaprates:
StandardizedCapRate =f(HedonicVarbs,TimeDummies)
Hedonicvarbs:
Age,Age^2,
LnSqft,
cbd_fg,
resolveddistress_fg,
cmbs_fg ,
leaseback_fg,
excess_land_potential_fg,
SellerDummyVars
PropertyType,RCAMetroDummies
Where:StandardizedCapRate =CapRate – AvgCapRate(byMetro& Year)
InthisspecificationAge&Age^2coefficientscapture
essentiallycross‐sectional variationincapratesasafunctionof
buildingage.Systematicvariationincapratesacrossmarkets&
acrosstimearecontrolledforbythestandardization.
RealDepreciationinU.S.CommercialProperties
MostlyduetoNOIdecline(onlyslightlytocapratecreep)
Resultsforthenationalall‐propertysample,73,229transobs,Price&Caprate modelstogether…
0.0
0.1
0.2
0.3
0.4
0.5
0.6
0.7
0.8
0.9
1.0
0 1020304050
RatiotoZero‐AgePropertyValue
PropertyAge(yrs)
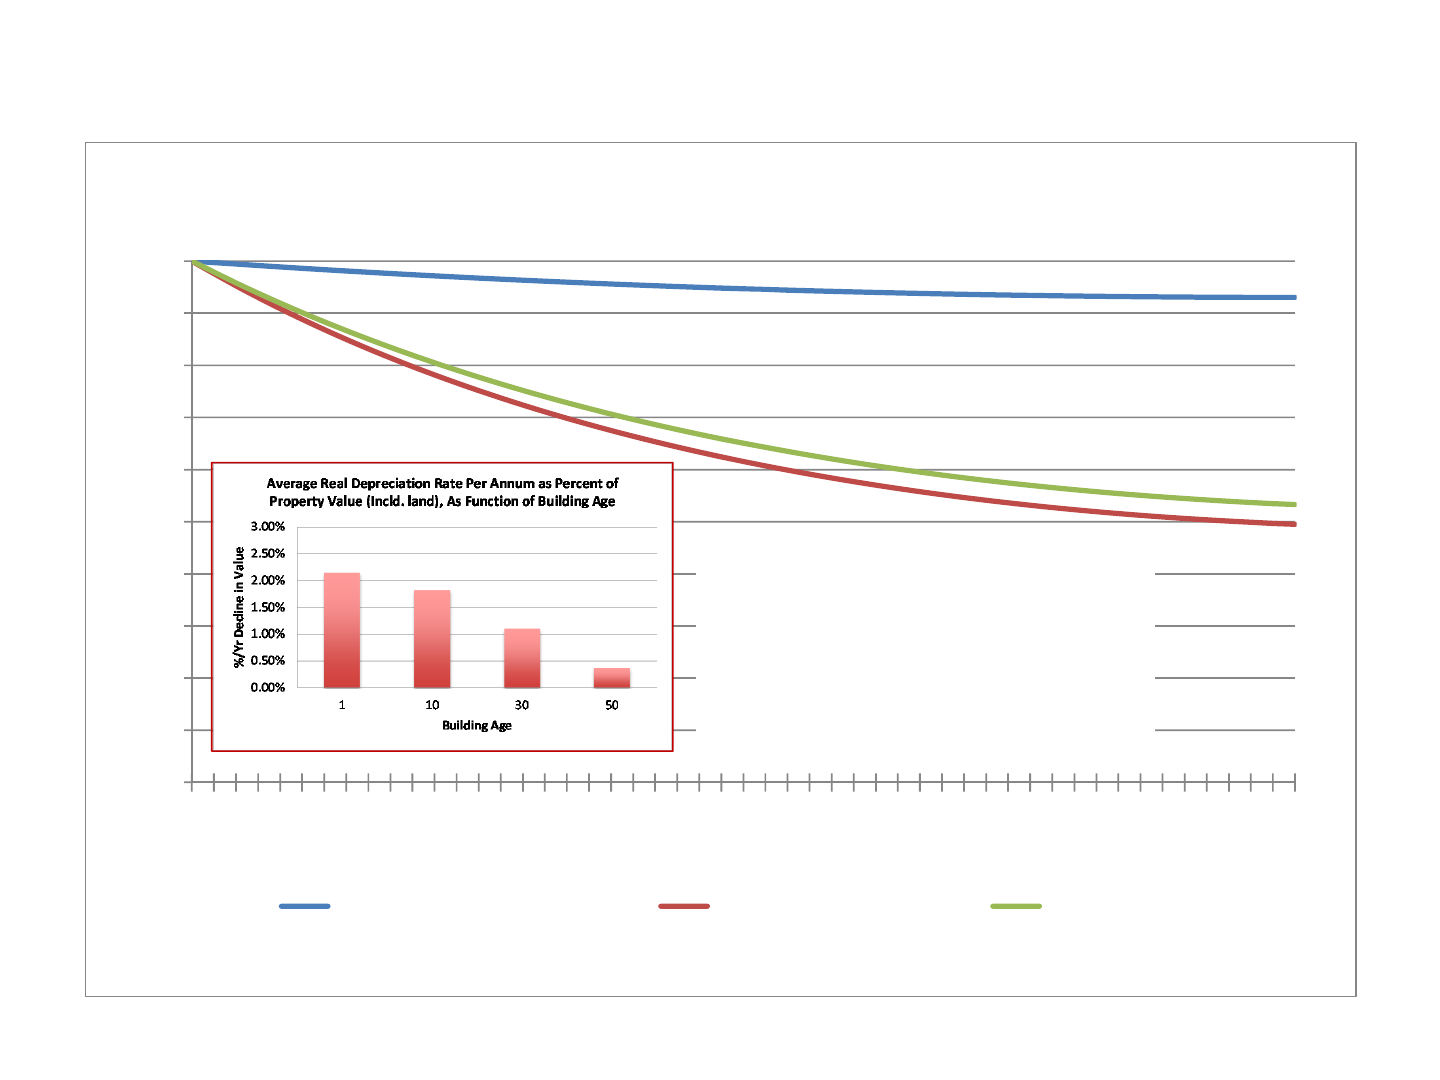
CumulativeEffectofRealDepreciatononPropertyValue(includingland):Dueto:
NOIEffect,CapRa te Effect,TotaloftheTwo
DuetoCapRateEffect TotalDepreciation DuetoNOIEffect
BasedondatafromRealCapitalAnalytics,Inc. forallU.S.commercialproperties>$2.5Mvalue
“NOI Effect” reflects some combination of lower rent, lower avg occupancy, or higher operating expenses.
Overallnatl average=1.3%oftotal
propertyvalueperyearduringfirst50years
sincebuildingconstruction.Younger
propertiesdepreciatefaster,probably
mostlybecausebuildingstructureissmaller
fractionofolderproperties’values.
1.62%
1.51%
0.11%
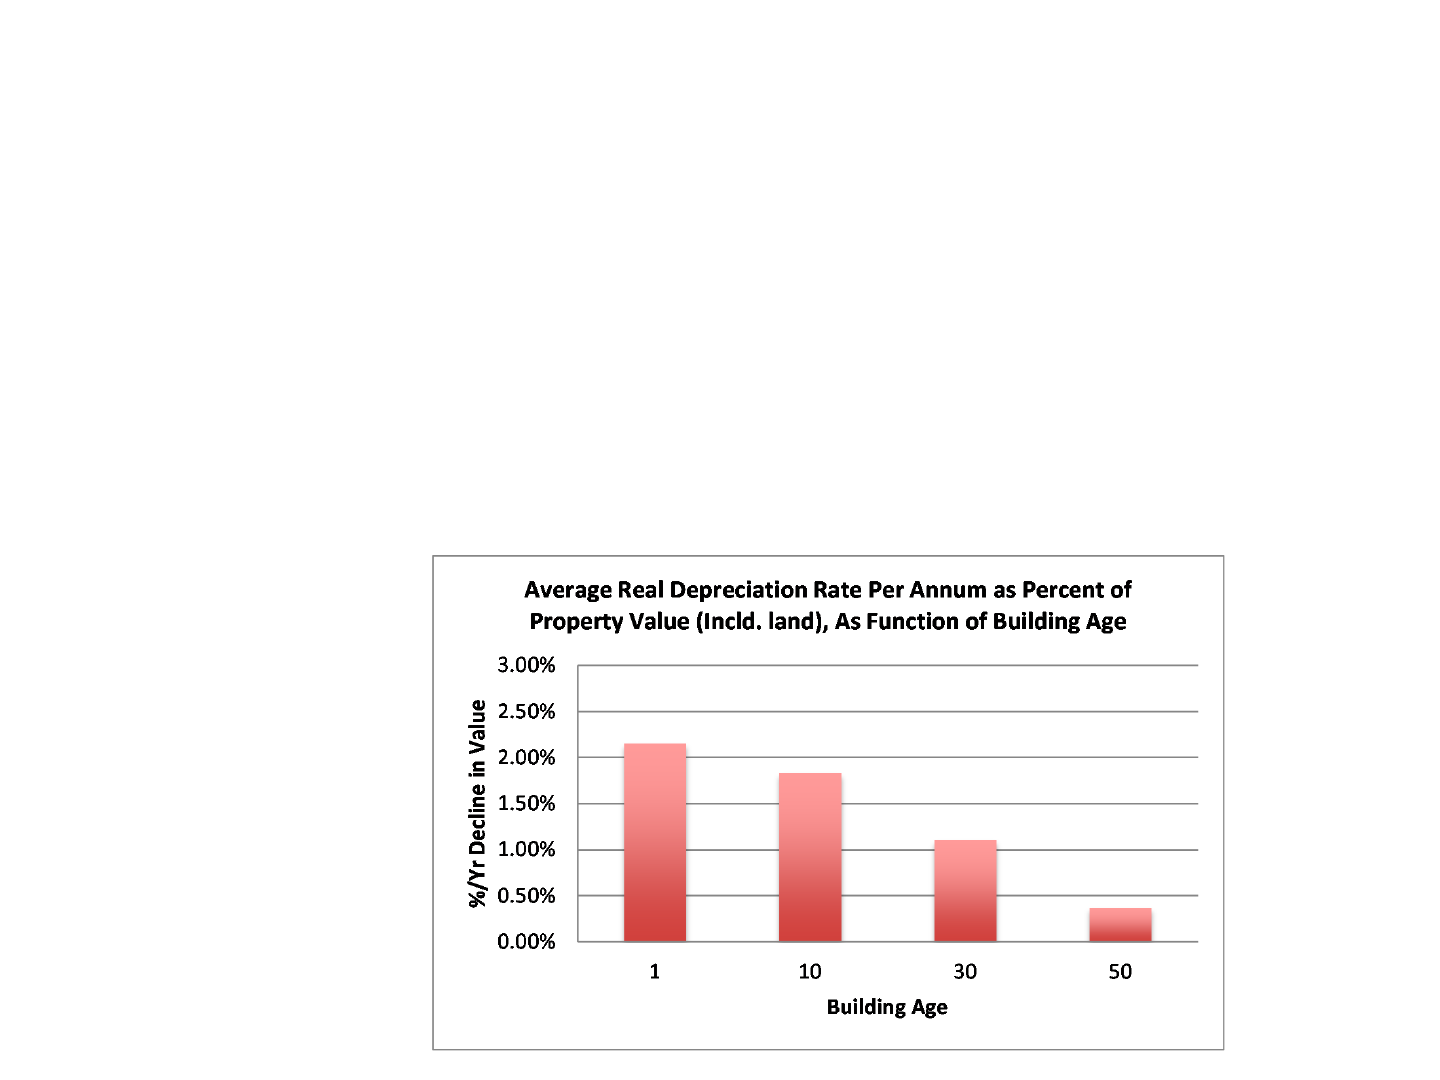
Magnitudeofrealdeprecation:
• Overallaveragerate:1.3%oftotalpropertyvalue(inclu land)peryear(basedon
medianpropertyage).
• E.g.,ifrealdeprec =1.3%andinflation=2.5%thenobservednominalincreasein
same‐propertypriceis2.5%‐ 1.3%=1.2%/yr onavg.
• Fasterdeprec rateinpropertieswithyoungerbuildings,mostlyduetodeclineof
structureproportionoftotalpropertyvalue(seenextslides).
• Equatestoapprox 6%/yr ofremainingstructurevalue(excludingland)for
median‐agebuilding(24yrs old).
• Thisisinspiteofcapex.E.g.,ifcapex averages2%ofpropertyvalue/yr,then
presumablywithoutthecapex therealdepreciationwouldbeatleast
1.3%+2%=3.3%ofpropval orabout16%ofremainingstructurevalue/yr.*
*
Atmedianbuildingagestructure
is20%oftotalpropertyvalue
depreciatingat6%/yr (ofstructure
value).Ifcapex is2%oftotal
propertyvalue,thenit10%of
structurevalue,hence,sumof
depreciation+capex asfractionof
remainingstructurevalueis:6%+
10%=16%.
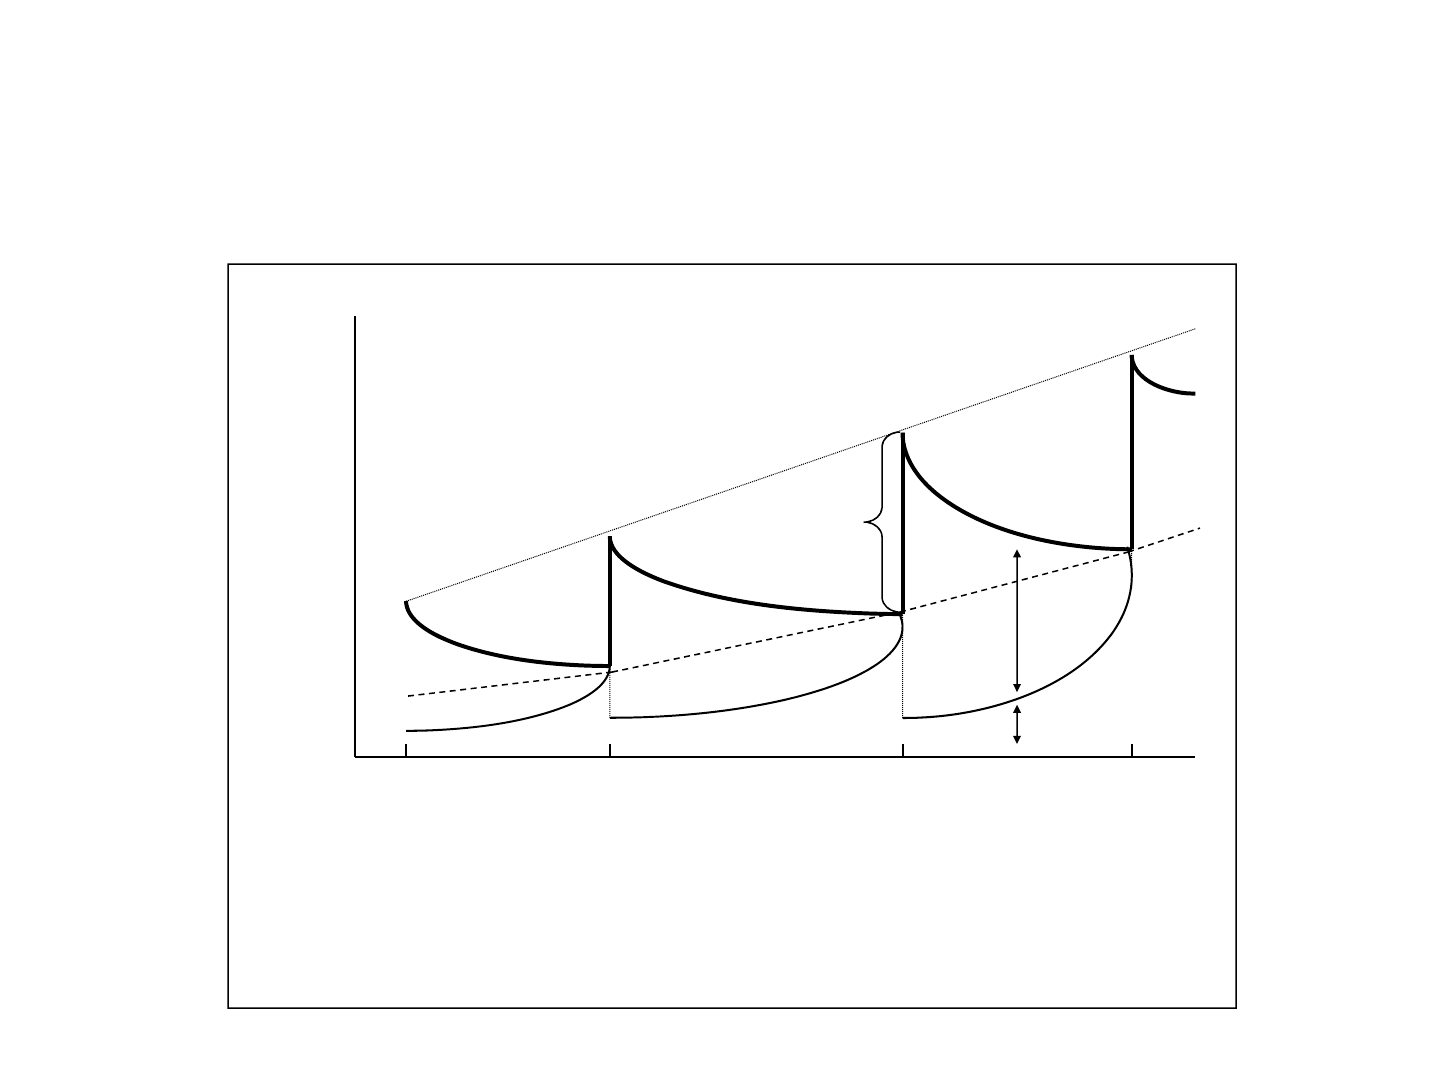
Property
$ Value
Components
Time
RR R R
R = Construction / reconstruction points in time (typically 30-100 yrs between)
U = Usage value at highest and best use at time of reconstruction
P = Property value
S = Structure value
L = Land appraisal value (legal value)
C = Land redevelopment call option value (economic value)
K = Construction (redevelopment) cost exclu acquisition cost
U
U
U
U
P
P
P
P
C
S
L
L
K
K
Stylizeddepictionofpropertylifecycle,valuecomponentsovertime:
Valueonasinglelandparcelinaplacewithincreasingreallocation
(usage)value,historyspanningperhaps200years.
Realdepreciationdragspropertyrealvalue(P)downbetween
redevelopments…
Computingtheimpliedaver agestructurelifetime…
Empiricallyestimatedhedonicpricemodel(asfcn ofbldg age):
Ln(P/SF)=‐0.0219474(Age)+0.0001843(Age
2
)
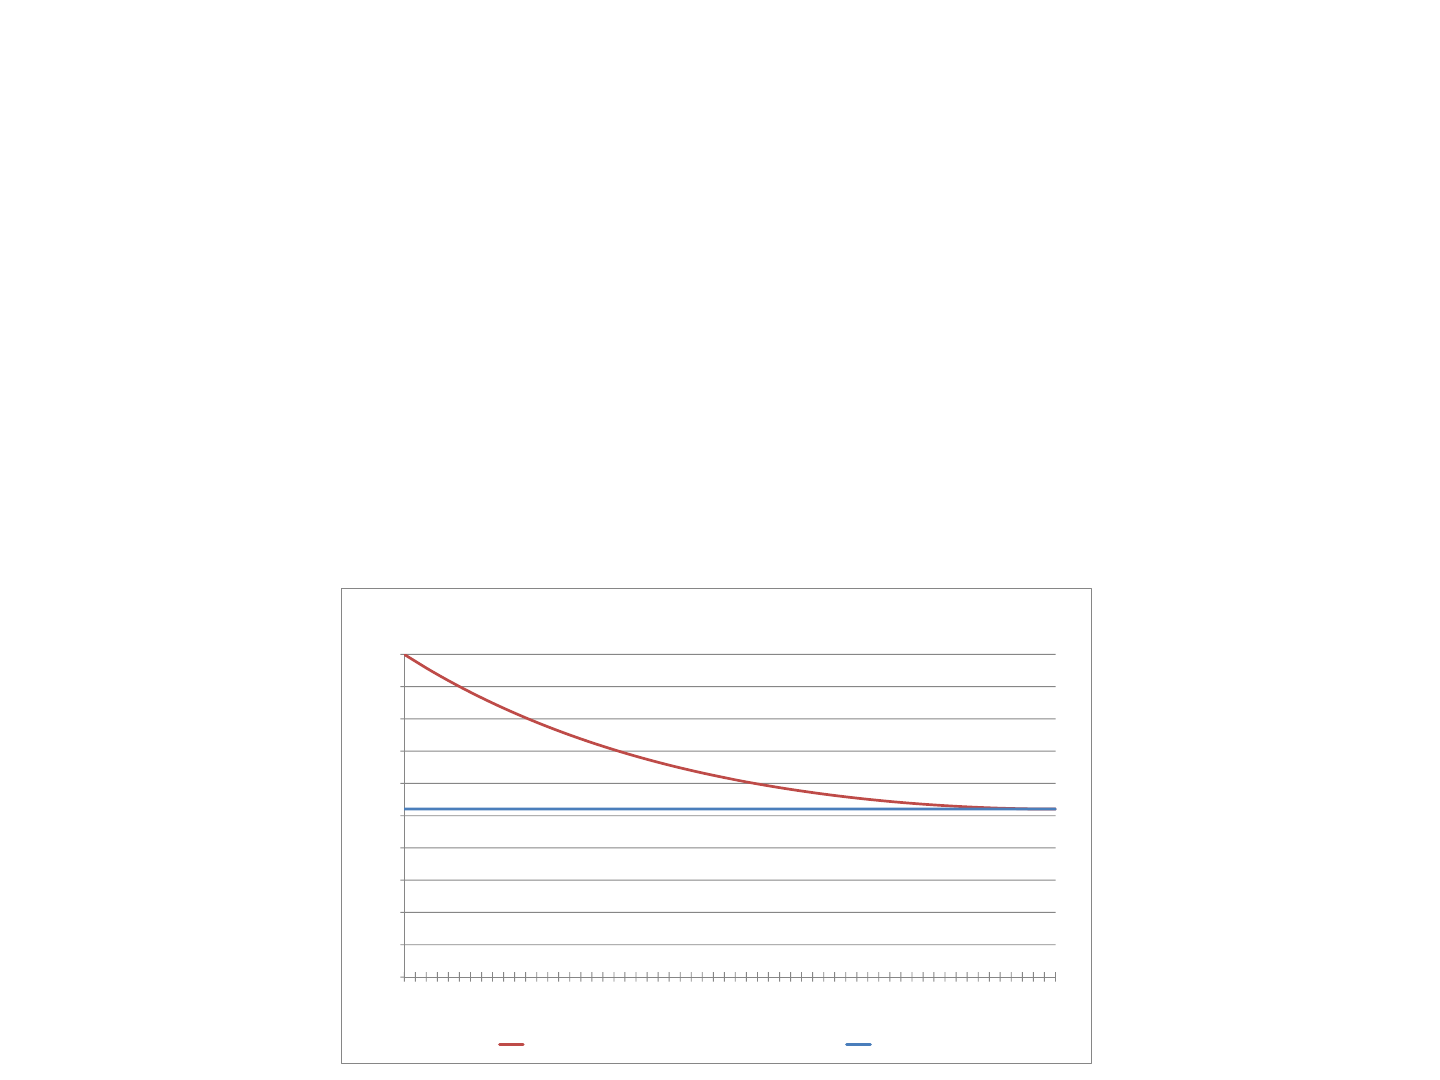
Thisisaquadraticfunction ofage.Ithasaminimumpoint(overAge).Beyond
thatminimumpointthereisnofurtherpropertydepreciation.Therefore,atthat
minimumpoint,thebuildingstructureisfullydepreciated(assumingthatitis
onlythestructurethatdepreciates,nottheland).
Findthisminimumpoint
usingcalculus(setderivativewrt Ageequaltozero):
dLn(P/SF)/dAge = ‐0.0219474+2*0.0001843*Age=0,
Ageatwhichnofurtherdepreciation=0.0219474/0.0003686=60yrs.
MinPoint
60yrs age
0.0
0.1
0.2
0.3
0.4
0.5
0.6
0.7
0.8
0.9
1.0
0 1020304050
RatiotoNewStructureValue
BuildingAge(yrs)
CumulativeEffectofRealDepreciatononRemainingStru ctu reValue(excludingland):
AssumingLandisInitially52%ofTotalPropertyValue&LandValueisConstantReal
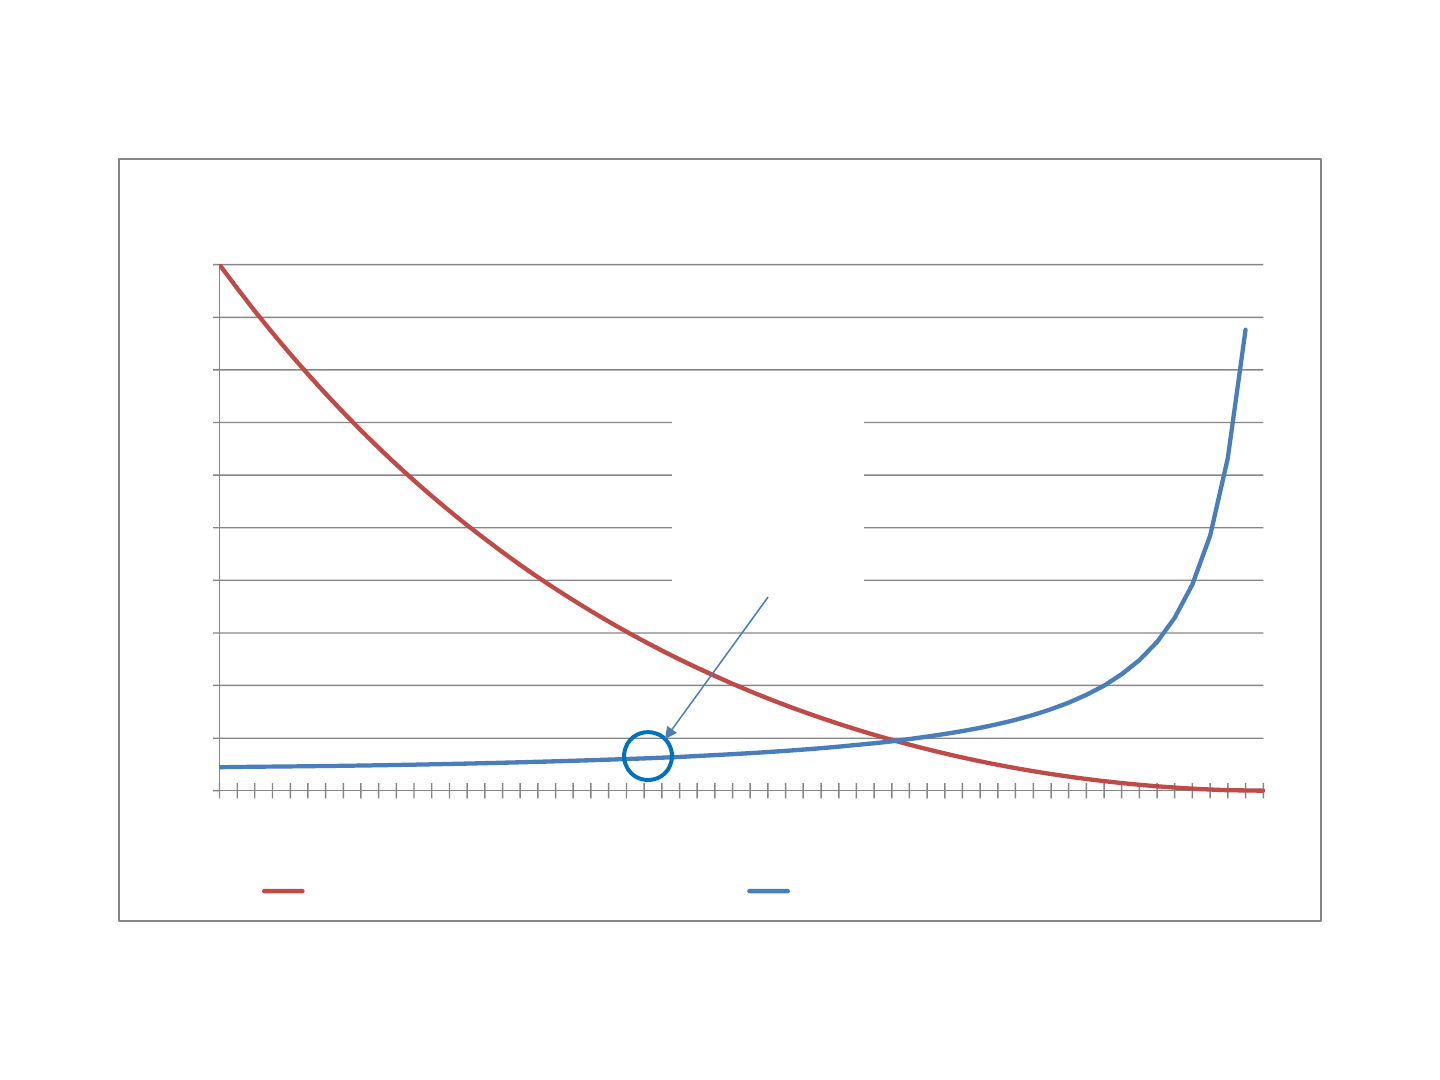
Computingtheimpliedlandvaluefractionat(re)development…
Ageatwhichnofurtherdepreciation=0.0219474/0.0003686=60yrs.
Whenthebuildingisnolongerdepreciatingitisworthless,hence,timefor
redevelopment.Atthatpoint,entirepropertyvalueislandvalue.Asafractionof
valueofnewly‐builtpropertyvalue,thispurelandvaluecomponent
foundby
pluggingthebuildinglifetimeage(i.e.,agewhenstructurebecomesworthlessas
indicatedbynofurtherdepreciation)backintoourhedonicpriceequationasa
functionofbuildingage(exponentiate togetfromlogstolevels):
Exp(Ln(P/SF))=Exp(‐0.0219474(60)+0.0001843(60
2
))=0.52.
Landvaluefractionis52%ofnewly‐builtpropertyvalue(structureis48%).
0.0
0.1
0.2
0.3
0.4
0.5
0.6
0.7
0.8
0.9
1.0
0 1020304050
RatiotoNewTotalPropertyValue
BuildingAge(yrs)
CumulativeEffectofRealDepreciatononRemainingPropertyValue:
Land&StructureComponents(60yearstructurelife)
RemainingPropertyValue(Land+Structure) LandValue
0.0
0.1
0.2
0.3
0.4
0.5
0.6
0.7
0.8
0.9
1.0
0 1020304050
BuildingAge(yrs)
RemainingStructureValue&StructureDepreciationRate:
AssumingLandisInitially52%ofTotalPropertyValue&LandValueisConstantReal
FractionofNewStructureValueRemaining DepreciationRate/YrFractionofRemainingValue
FractionofStructureValueRemaining
&
RateofStructureDepreciation/Yr…
6%/yr @
Median
Bldg Age
(24)
0.0
0.1
0.2
0.3
0.4
0.5
0.6
0.7
0.8
0.9
1.0
RatiotoZero‐AgePropertyValue
PropertyAge(yrs)
CumulativeEffectofRealDepreciatononPropertyValue(includingland):
Non‐ParametricModel
Non‐parametricmodelalsosuggestsdepreciationpetersoutinthe
40to90yearagerange,withstillabouthalfoforiginalproperty
valueremaining…
However,thebuildingsalesdatabaseisinherently“rightcensored”:
Doesnotincludethepropertiesthatweredemolishedalready.
Furtherwork(notreportedhere)willexaminedata
ondemolitions.
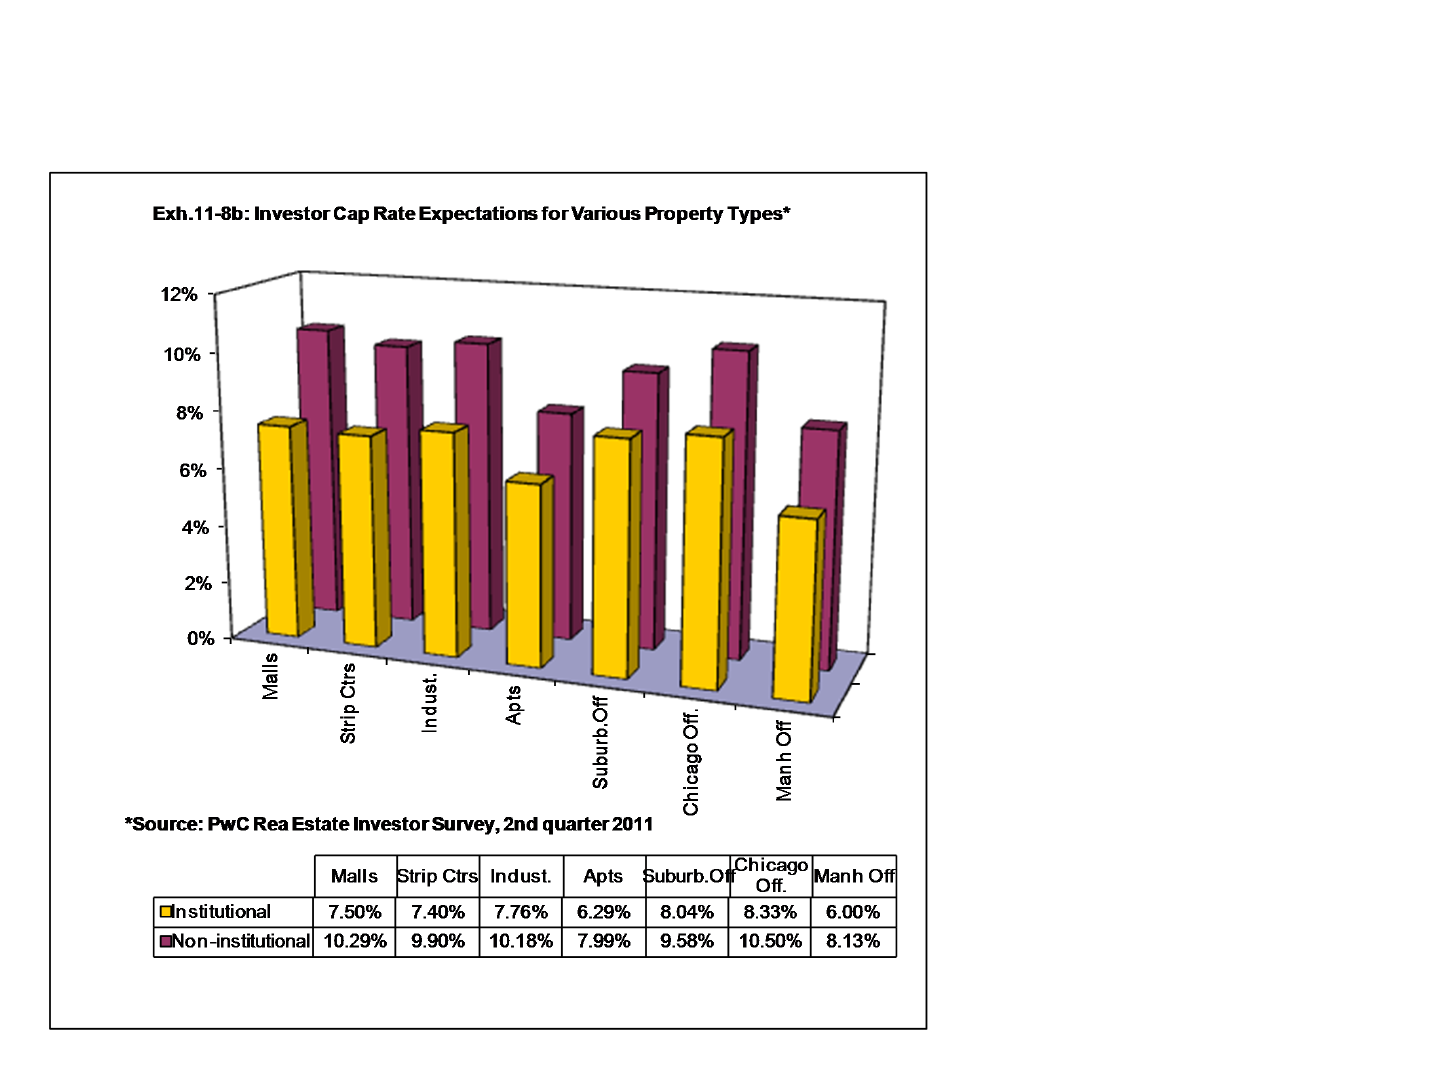
Thefindingaboutthesmallroleofcapratecreepisalittlesurprising.Typicalindustry
expectationsarethat“non‐institutional”propertysellsatcapratesabout200bpsabove
“institutional”property.Supposingthisreflectsdepreciationofanew“institutional”
propertytoafully“non‐
institutional”propertyovera
50‐year
period,thenthis
impliesacapratecreepeff ect
ofabout50bps/year:
((1/.10)/(1/.08))^(1/50)‐1=‐.0045
Yetwefindanaveragecaprate
creepeff ectonvalueofonly11
bps/yr.Thisimpliesthatthe
NOIsourceofrealdepreciation
(rent– vacancy–oper
expenses)accountsabout93%
ofpropertyrealdepreciation,
implyingNOIofavg 50‐yr‐old
bldg is53%thatofnewbldg in
realterms.Ifsomeofthisis
duetoloweroccupancy&
higheroper exps,thenthisis
consistentwithnon‐instl rents
approx 2/3ofotherwise
equivalentinstl rent.
Source:©Exh.11‐8b(p.251)Geltner‐Miller“CommercialReal
EstateAnalysis&Investments”3e,OnCourse Learning(2014)
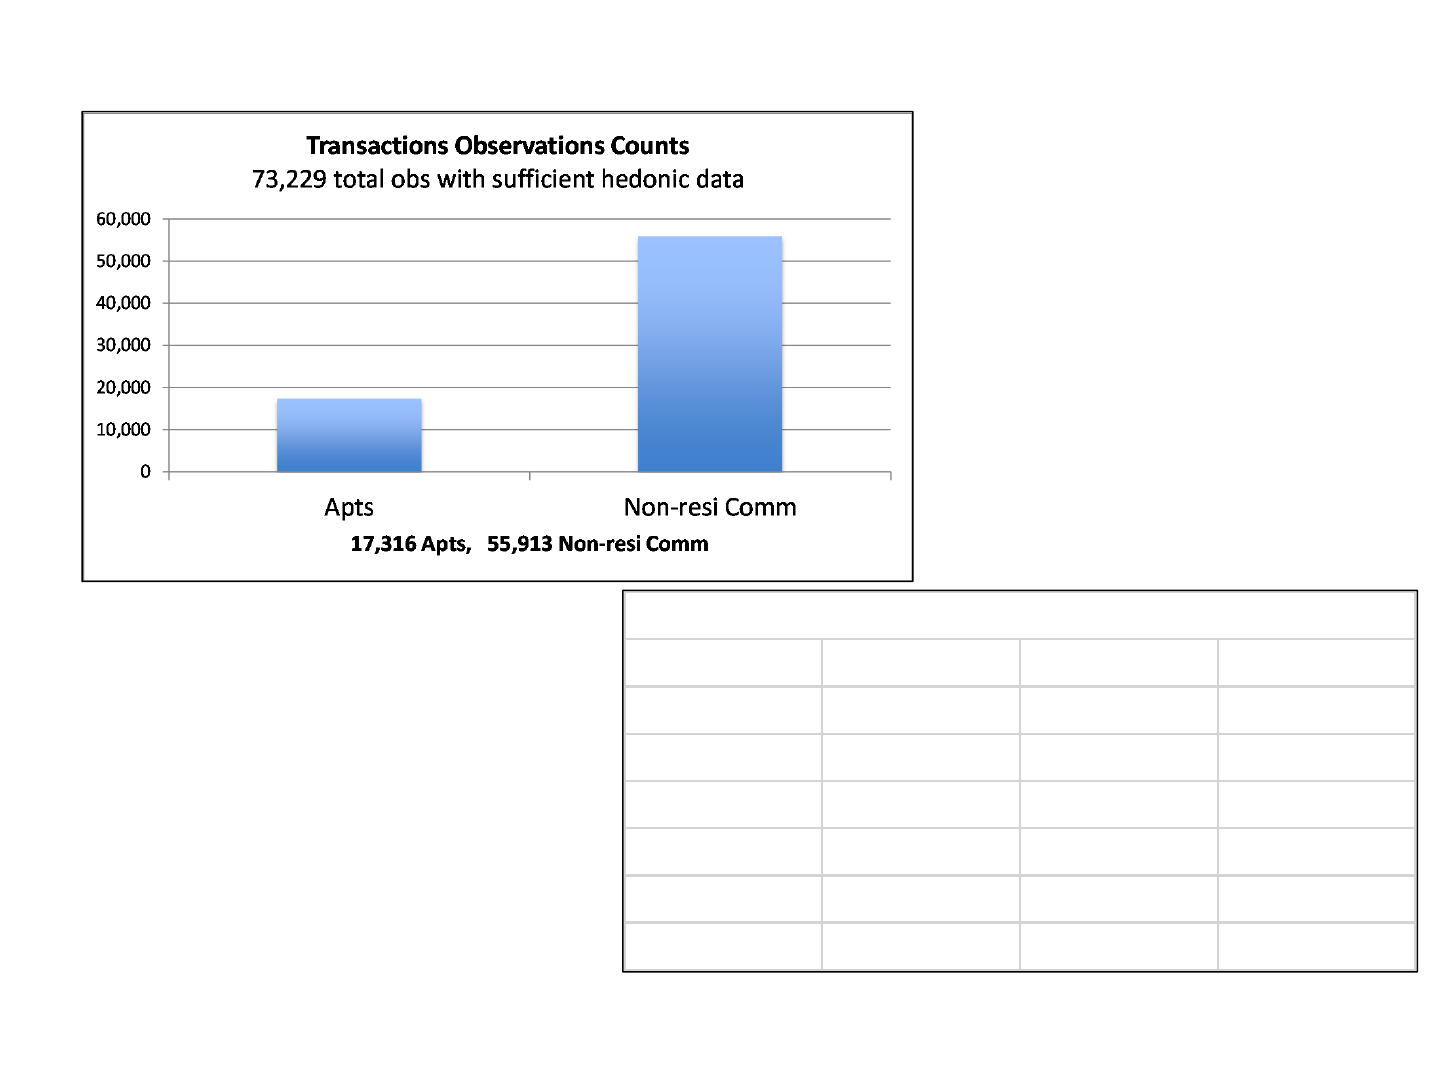
RCAdatabaseobs withpreviously‐notedhedonicvariablesandsalesbetween2001&
1Q2013:MoreComm thanApts,andApts avg almost10yrs olderthanComm…
Note:wehavefilteredoutthefewobs withpropertyage>100yrs,toavoid“historicalstructure”eff ects.
AGEMeans&Mediansin theSamples:
Sam pleNMean Median
Natl‐AllProp 73229 29 24
Natl‐Ap ts 17316 37 33
Natl‐Comm 55913 27 22
Capratesubs 21910 24 20
Bu bble 23885 30 24
Non‐Bu bble 49344 29 24
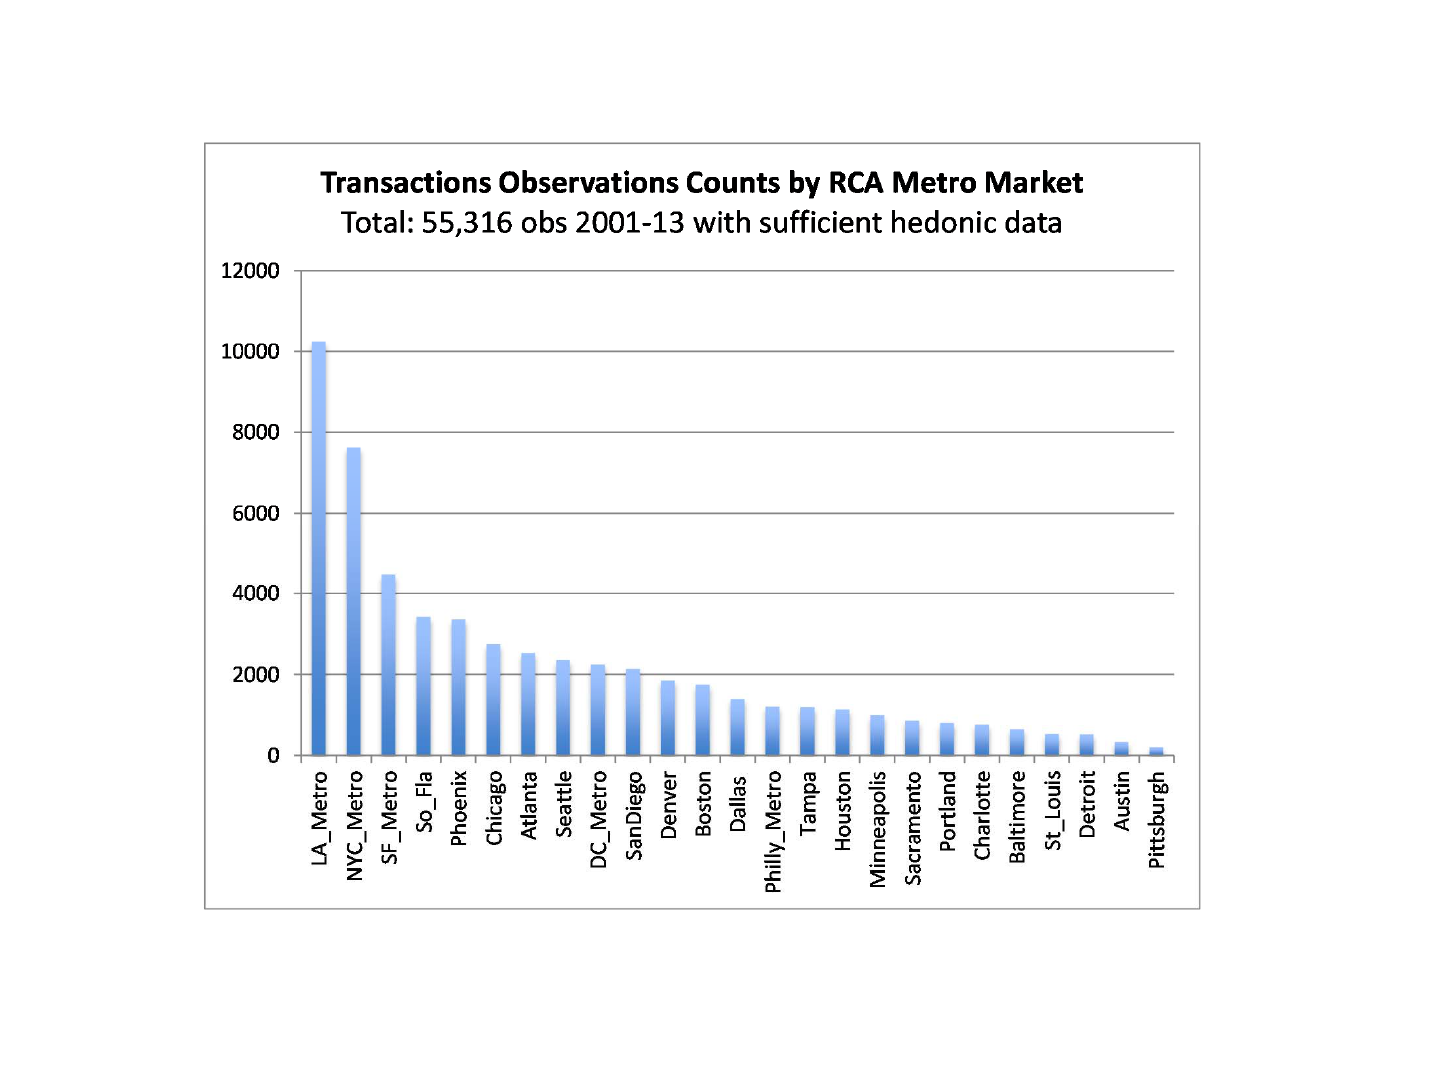
MaxisLA_Metro with10,246obs;Min isPittsburghwith208obs.
RCAdatabaseobs withpreviously‐notedhedonicvariablesANDlocatedintop‐25
RCAmetros(byobs),salesbetween2001&1Q2013:
0
0.2
0.4
0.6
0.8
1
1.2
0 1020304050
RatiotoNewlyBuiltPropertyValue
StructureAge(yrs)
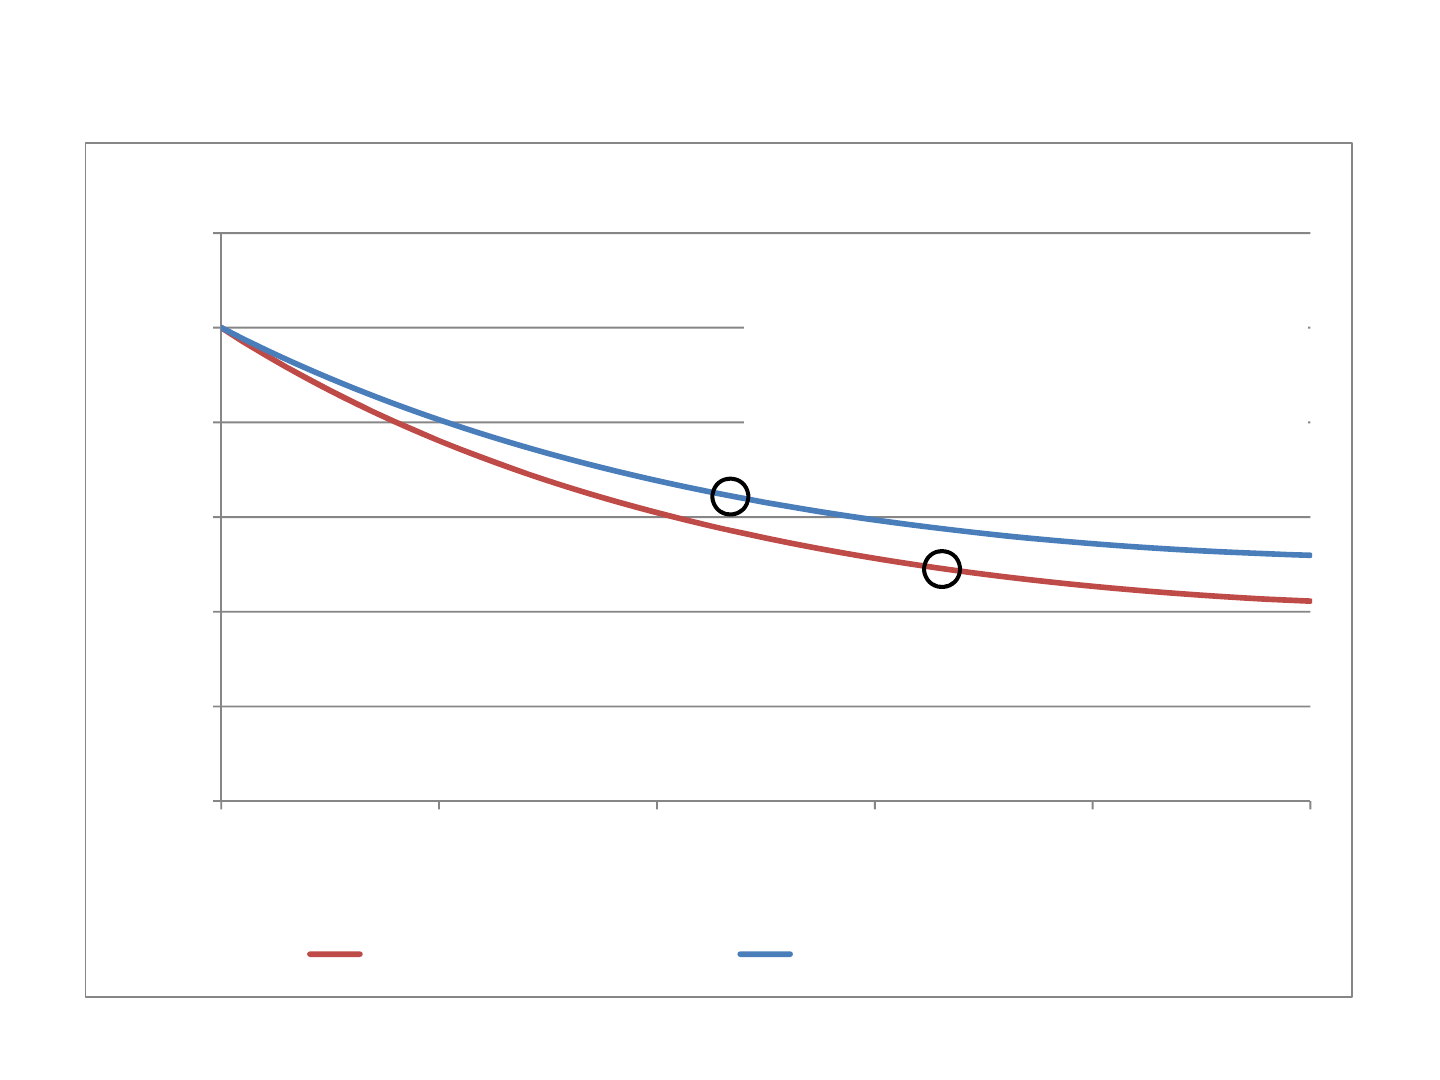
CumulativeEffectofRealDepreciationonPropertyValue(includingland)
TotalDepreciation‐Apts TotalDepreciation‐Comm
Intheaggregate,apt &non‐resi commercial depreciationisverysimilar
(controllingforage,slightlymoreinapts,avg 1.7%/yr vs1.3%/yr)
BasedondatafromRealCapitalAnalytics,Inc. forallU.S.commercialproperties>$2.5Mvalue
Becauseinoursampletheavg apt is10yrs
olderthantheavg non‐resi comm property
(median33vs 22 yrs old),thedepreciation
rateofthemedianpropertyisactuallyslightly
lowerinapts:1.34%vs 1.45% /yr.
‐1.34%
‐1.45%
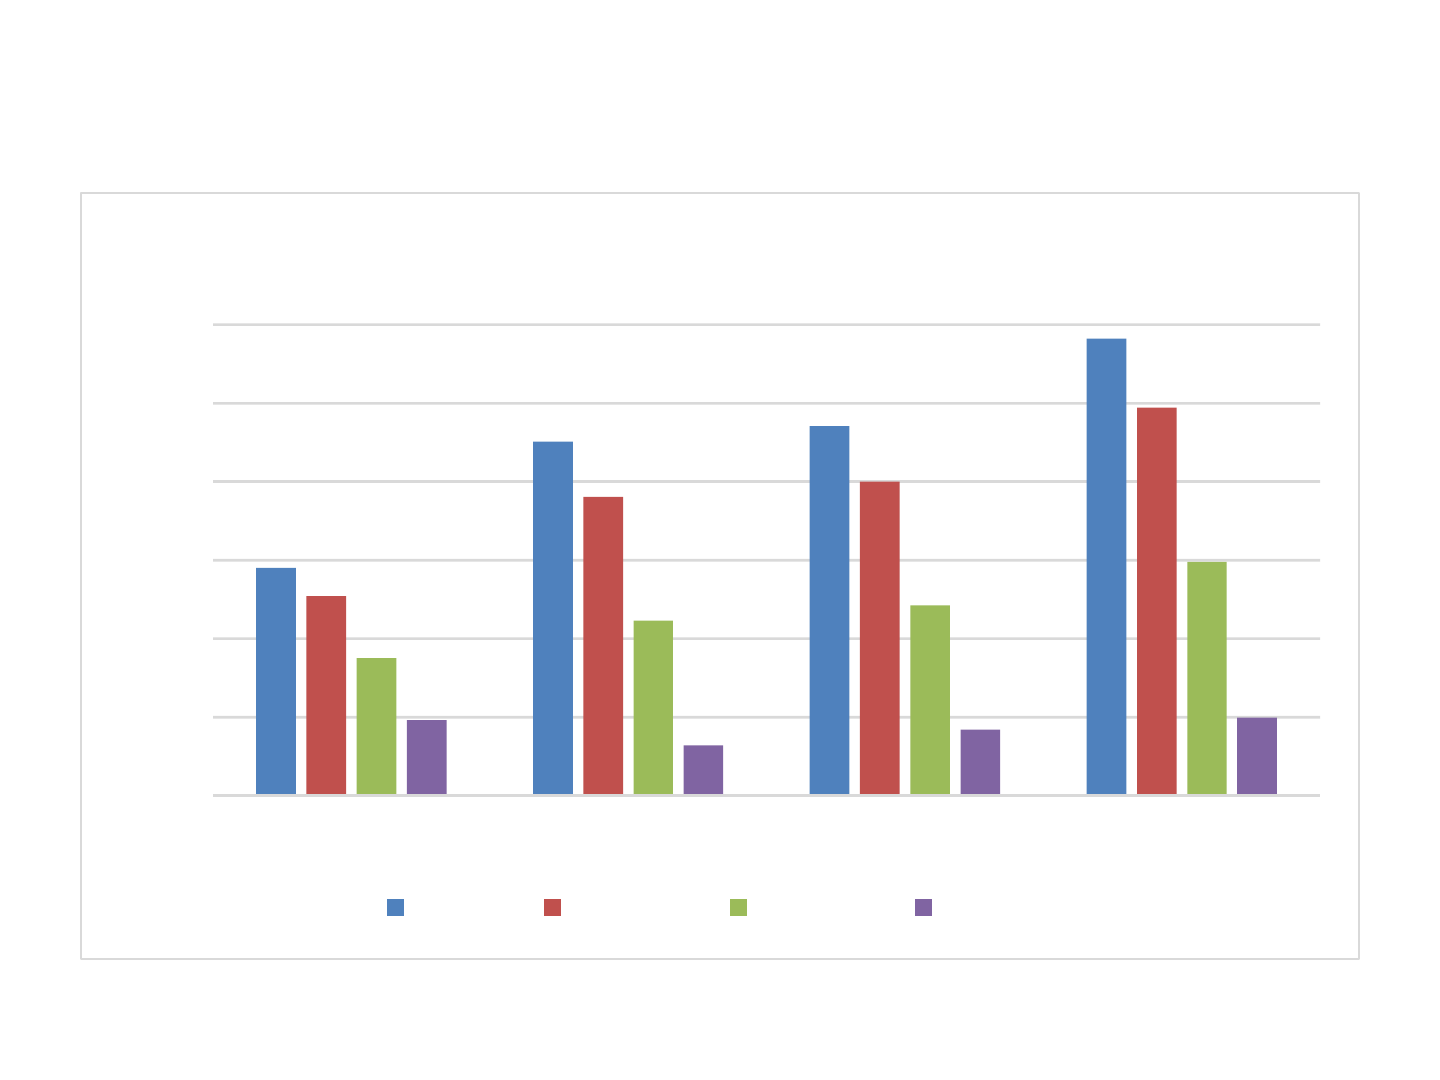
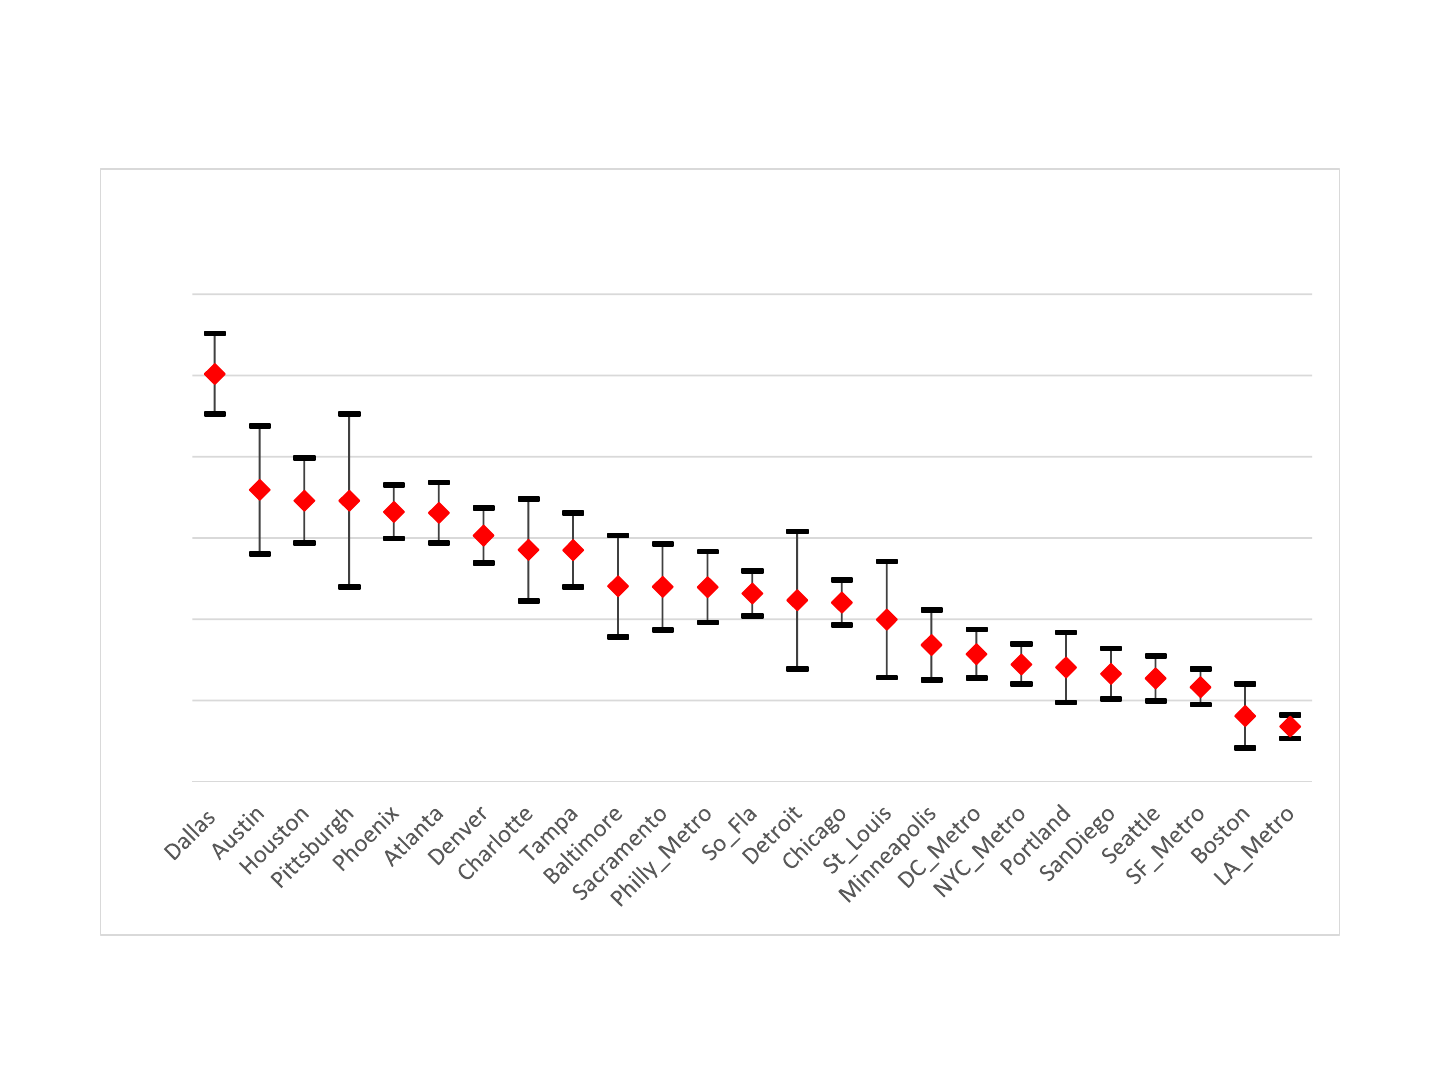
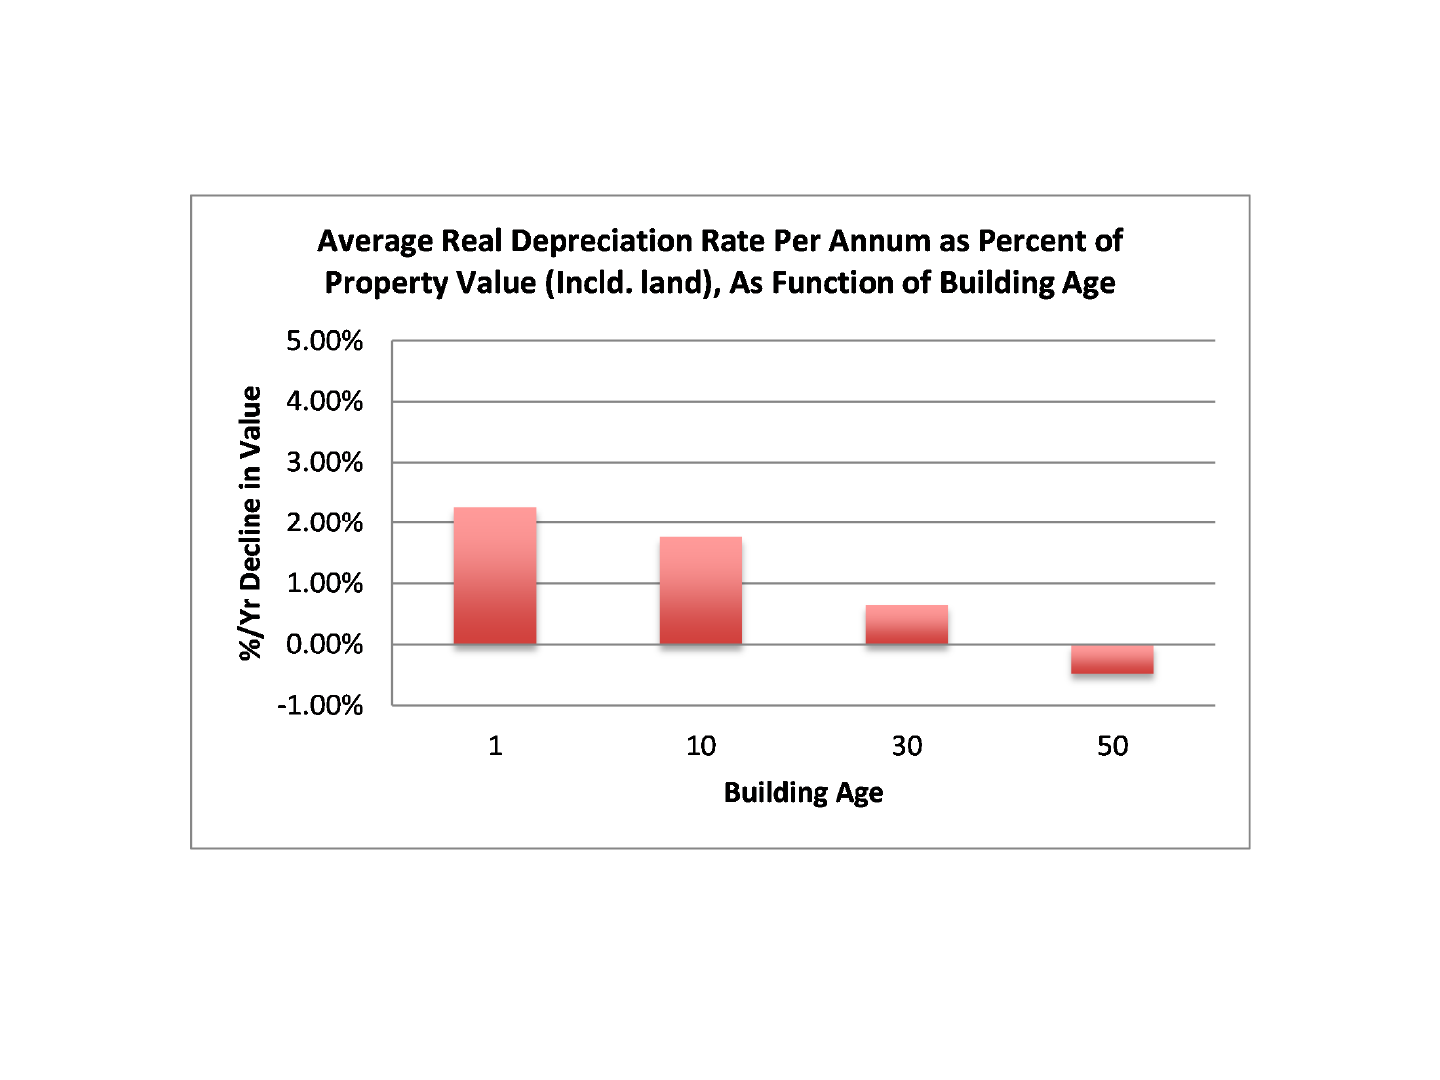
Untilbuildingsareveryold,apartmentpropertiesdepreciateslightlyfaster,
industrialslightlyslower,office&retailinbetween.Propertieswithyounger
buildingsalwaysdepreciatefaster(smallerlandvaluefraction).
BasedondatafromRealCapitalAnalytics,Inc. forallU.S.commercialproperties>$2.5Mvalue
0.00%
0.50%
1.00%
1.50%
2.00%
2.50%
3.00%
Ind Off Ret Apt
DepreciationRatesByBuildingType&Age
1yrold 10yrsold 30yrsold 50yrsold
Depreciationperyearasfractionoftotalpropertyvalue(includingland)
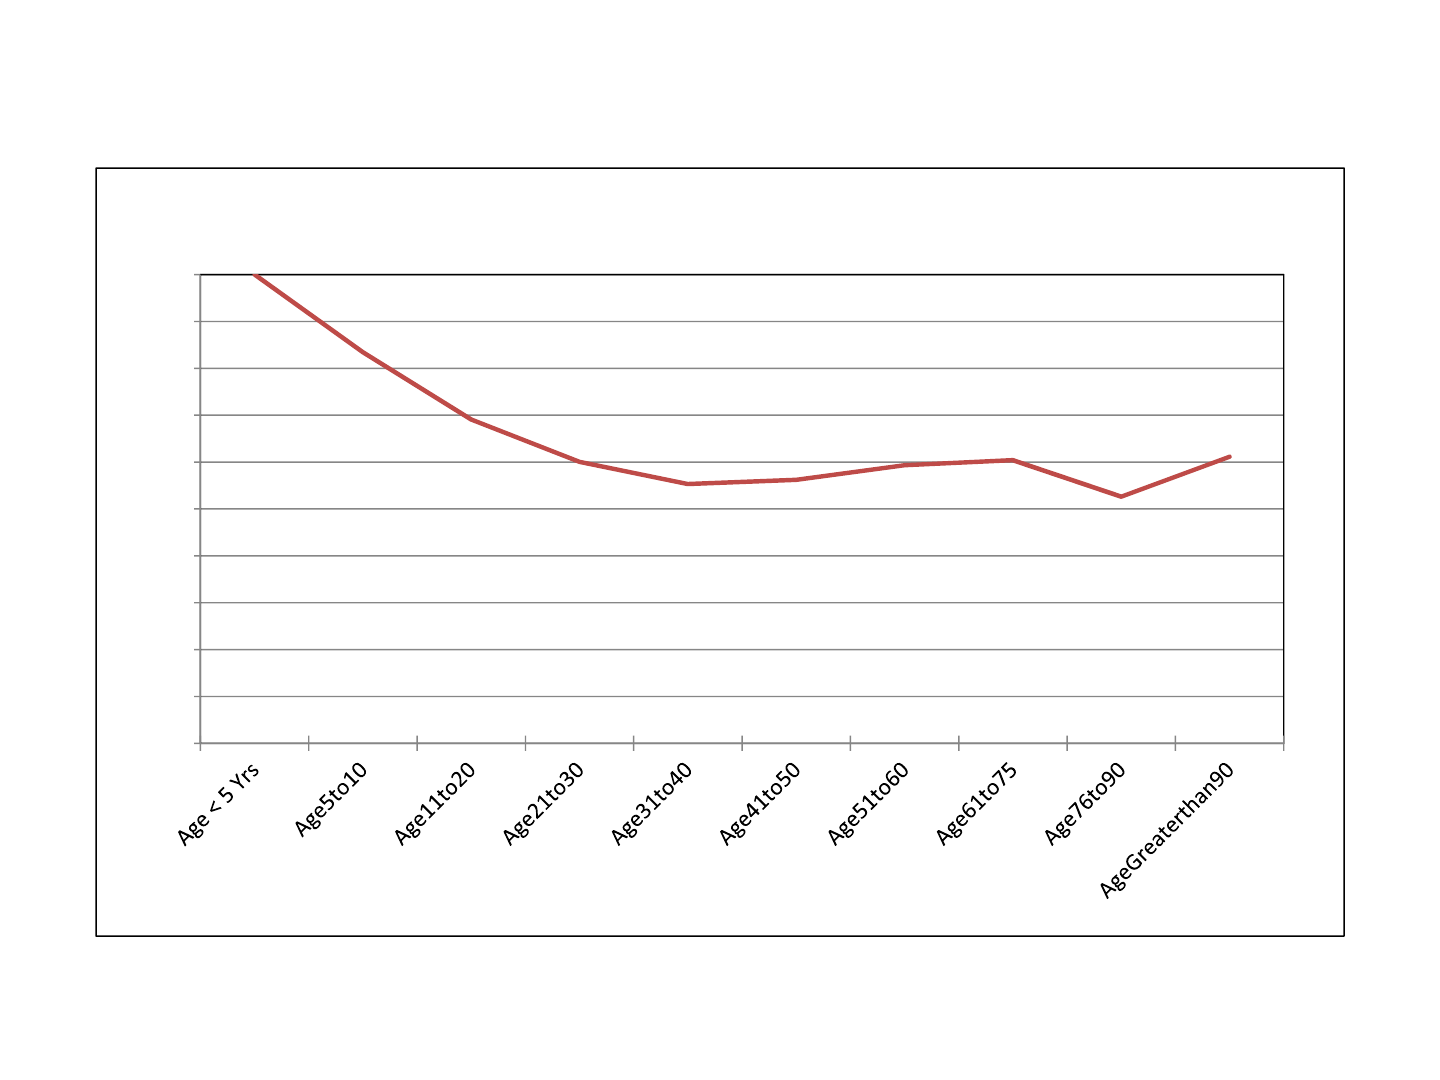
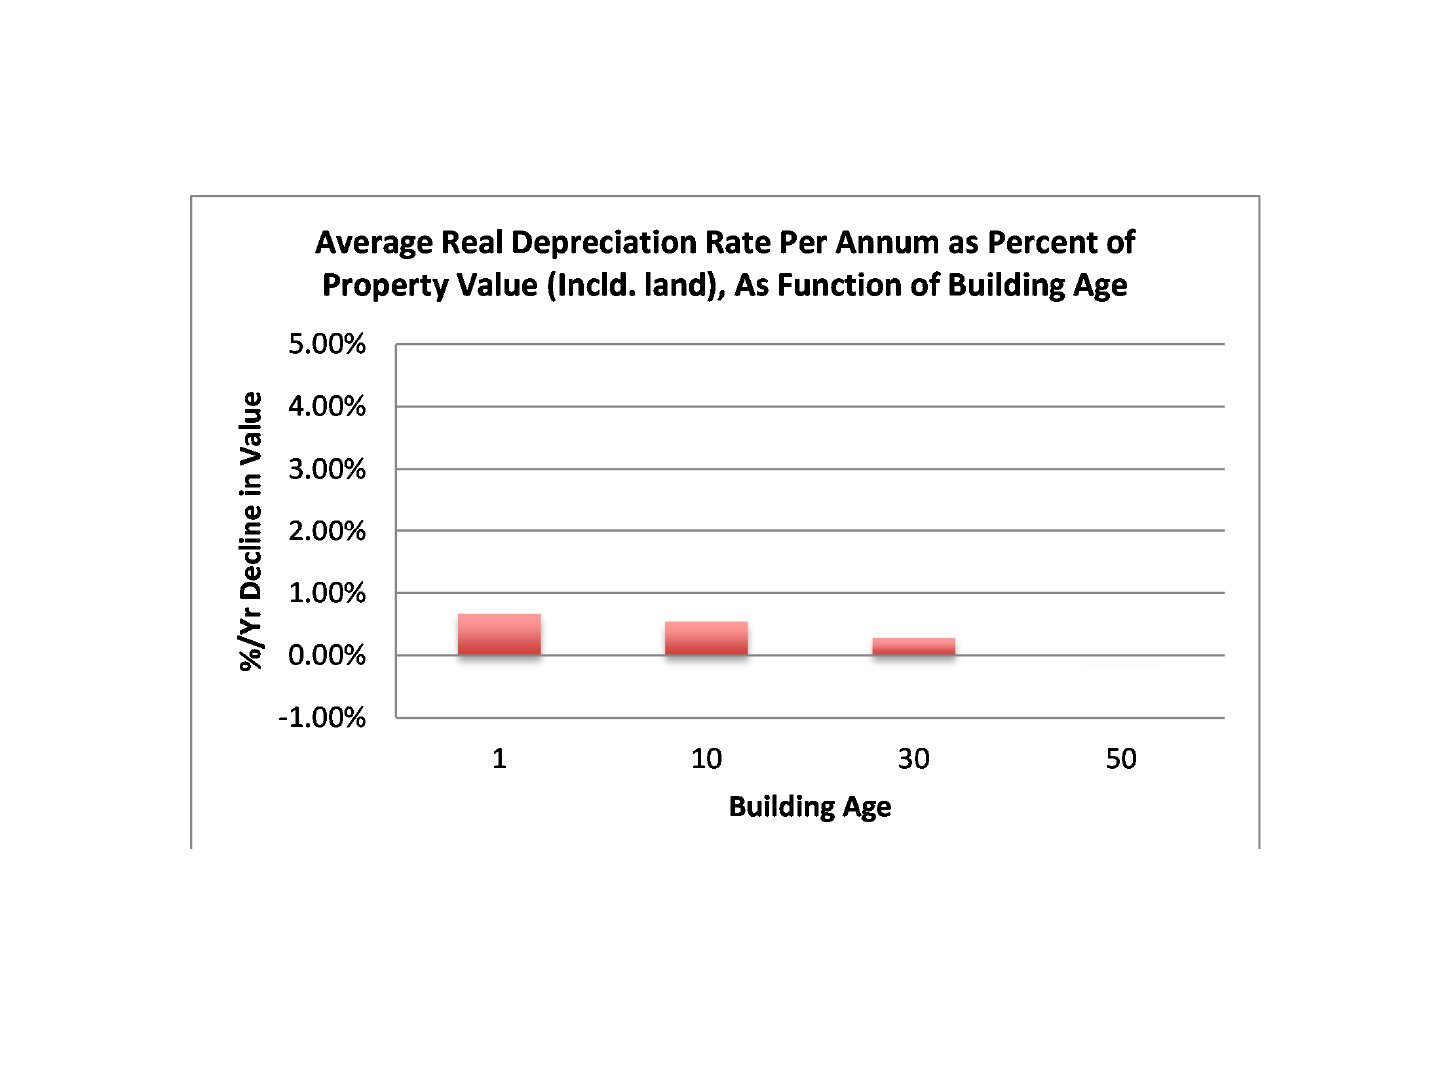
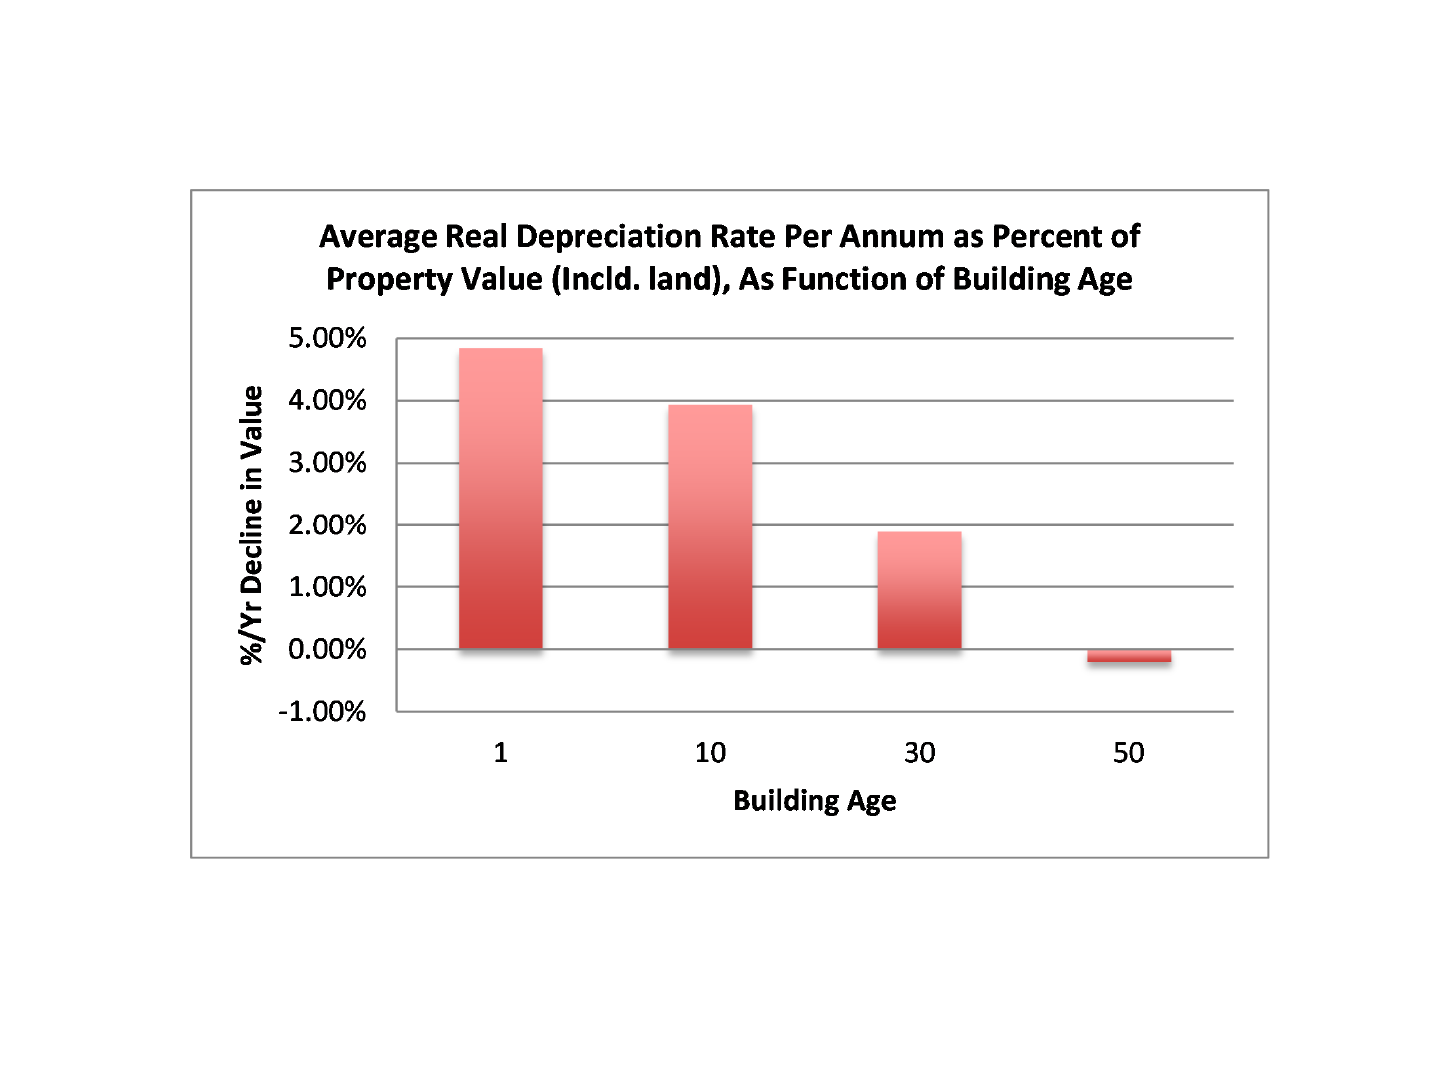
Estimateddepreciationratesasafunctionofbuildingage,byRCAMetroMkt,sortedfrom
highesttolowestdepreciationrates…
Real Depreciation Rates Per Annum:
Metro Market: 1 10 30 50 Average
Dallas 4.84% 3.94% 1.89% -0.20% 2.62%
Houston 3.38% 3.03% 2.25% 1.46% 2.53%
Austin 3.50% 3.01% 1.92% 0.81% 2.31%
Pittsburgh 3.37% 2.88% 1.79% 0.69% 2.18%
Charlotte 2.79% 2.42% 1.60% 0.77% 1.90%
Denver 2.96% 2.49% 1.45% 0.39% 1.82%
Atlanta 3.22% 2.65% 1.36% 0.05% 1.82%
Phoenix 3.23% 2.64% 1.31% -0.04% 1.79%
Tampa 2.78% 2.34% 1.36% 0.36% 1.71%
Baltimore 2.36% 2.05% 1.36% 0.67% 1.61%
Sacramento 2.35% 2.03% 1.30% 0.57% 1.56%
Philly_Metro 2.35% 2.02% 1.29% 0.56% 1.56%
Chicago 2.16% 1.89% 1.27% 0.64% 1.49%
Detroit 2.19% 1.85% 1.09% 0.33% 1.37%
St_Louis 1.96% 1.68% 1.05% 0.42% 1.28%
Minneapolis 1.66% 1.49% 1.12% 0.74% 1.25%
So_Fla 2.26% 1.76% 0.65% -0.47% 1.05%
DC_Metro 1.55% 1.33% 0.84% 0.34% 1.01%
Portland 1.39% 1.23% 0.89% 0.54% 1.01%
NYC_Metro 1.42% 1.20% 0.72% 0.23% 0.89%
Seattle 1.25% 1.07% 0.65% 0.24% 0.80%
SF_Metro 1.15% 0.99% 0.65% 0.30% 0.77%
SanDiego 1.30% 1.04% 0.46% -0.13% 0.67%
Boston 0.80% 0.72% 0.54% 0.37% 0.61%
LA_Metro 0.67% 0.55% 0.28% 0.01% 0.37%
Average 2.28% 1.93% 1.16% 0.39% 1.44%
All estimated rates are statistically significant
Building Age (Yrs):
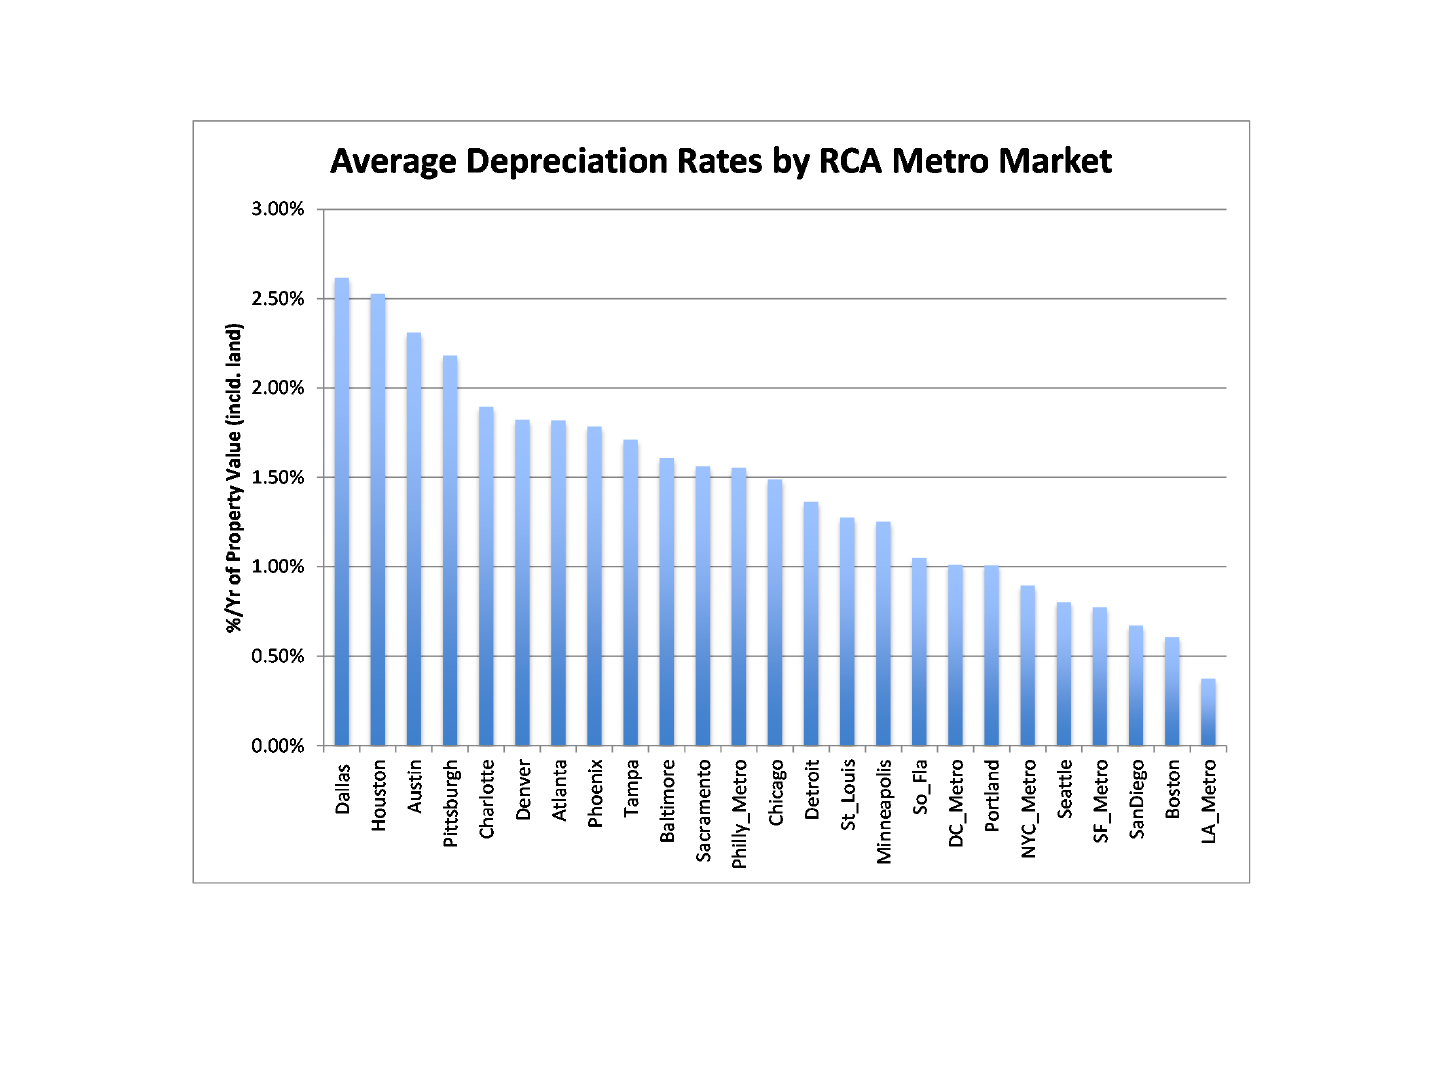
Depreciationvariesstronglybymetroarea:
Biggermoreland‐constrainedcitiesshowlessdepreciation…
Thesearethe(absval ofthe)estimatedcoefficientsontheAgevariablebyMetro,
wherebldg ageismeasuredinyears,+/‐ 2Std.Errs:
(Note:TheAge^2coefficient,notshownhere,makesthedepreciationrate/yr afunctionofbldg age,notindicatedhere.)
0%
1%
2%
3%
4%
5%
6%
AbsoluteValueofEstimatedCoefficientonBuildingAge(Yrs):
+/‐ 2Std.ErrRange
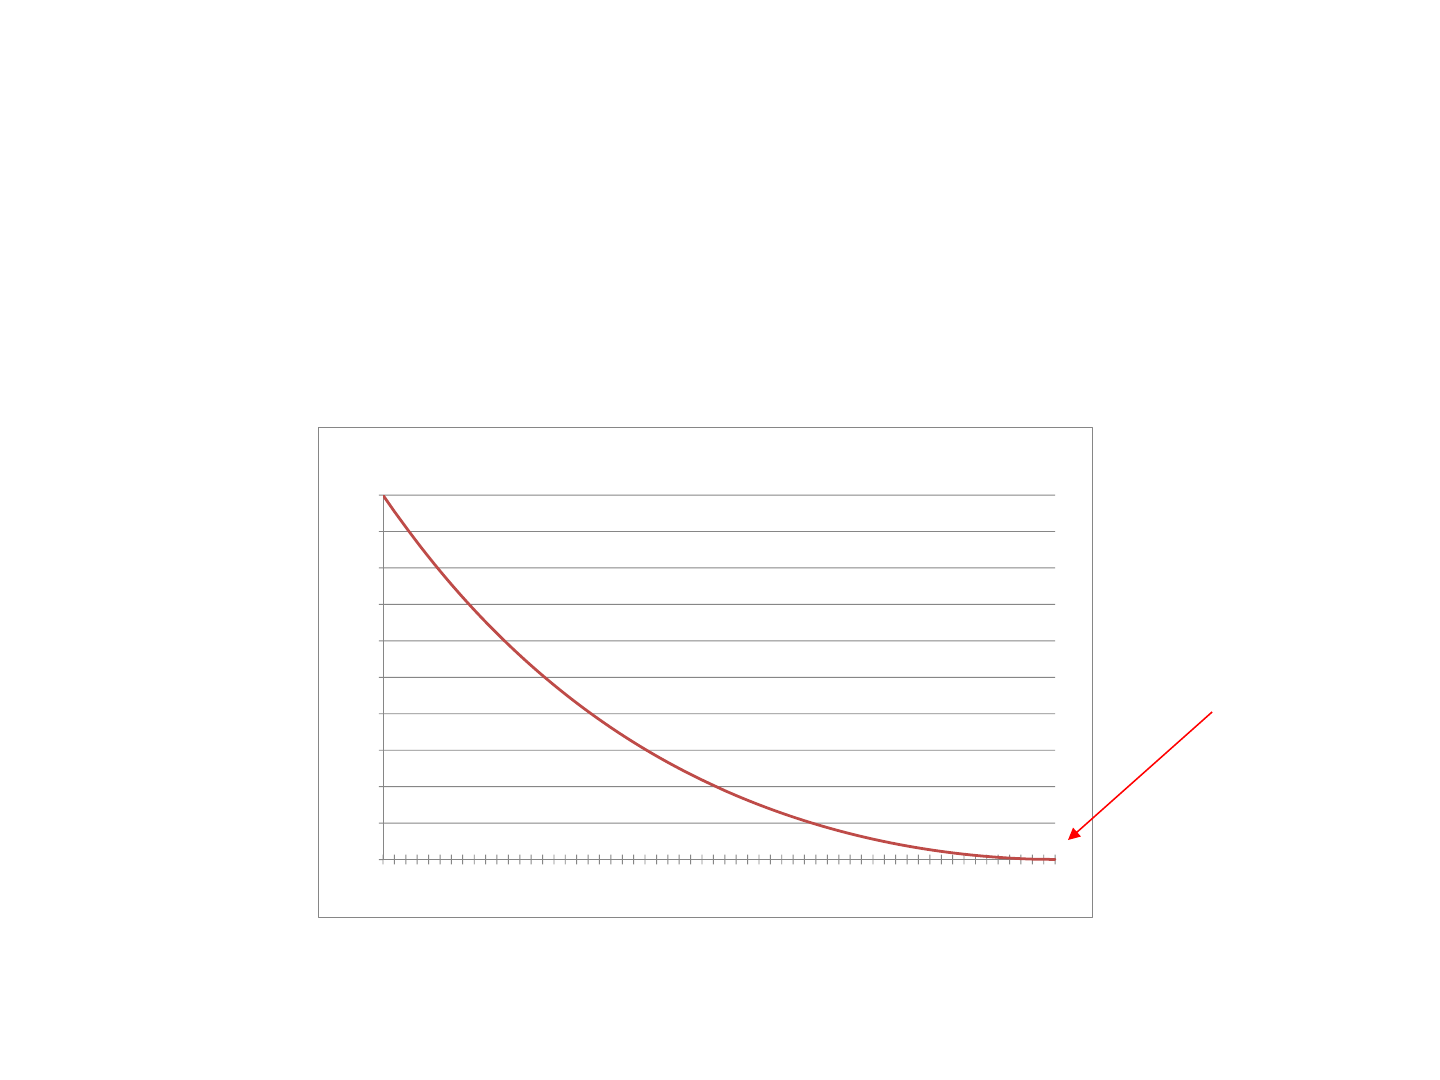
Insomemetros,oldbuildings(near50yrs)stopdepreciating,
perhapsbecausethestructureisvirtuallyworthless(allland
value)…Here:Depreciation&bldg ageinSouthFloridaMetro:
So.Fla Metroisstrongestexample,butthereareothersamong
thetop25RCAmetros:Atlanta,Dallas,Phoenix,SanDiego.
LA_Metro alsostopsdepreciating, butitalmostnev erstarts
depreciating…
LosAngeleshasverylittledepreciation.
(Note:LA_Metro hasmostdata,hence,mostprecisedepr estimates.)
Otherswithverylowdep:Boston,SF,SD,Seattle.
(NYC_Metro &DC_Metro arelowbutnotaslowduetotheirapts depreciatemuchfasterthantheirnon‐resi comm,perhapsanon‐CBDeffect.)
Dallas hasthemostdepreciation(amongthelargest25)…
Otherswithveryhighdep:Houston,Austin,Pittsburgh,Charlotte
(andunlikeDallas,theseothersshownowsignofdepreciation
endingbyage50).
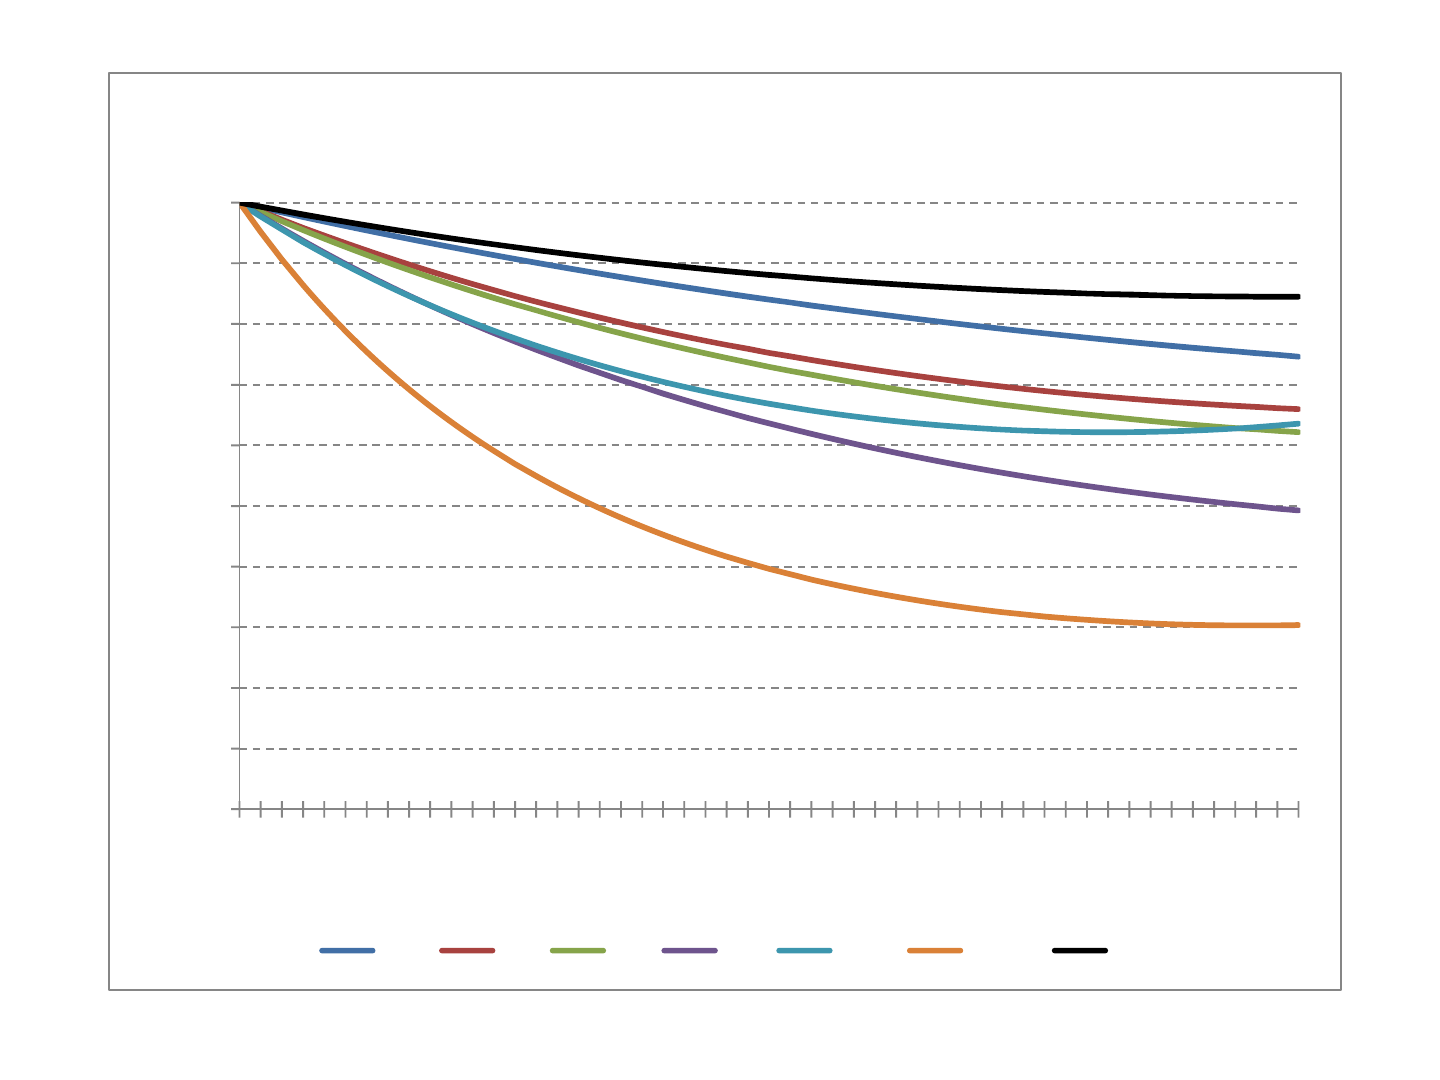
0
0.1
0.2
0.3
0.4
0.5
0.6
0.7
0.8
0.9
1
0 1020304050
RatiotoZero‐AgePropertyValue
PropertyAge(yrs)
CumulativeEffectofRealDepreciationonPropertyValue(includingland):
ComparisonofSeveralMetroAreas
Bos NY DC Chi SoFL Dallas LA
Depreciationrates&age‐profilesdifferacrossmetros
LA
NY
DC
Bos
Chi
SoFL
Dal
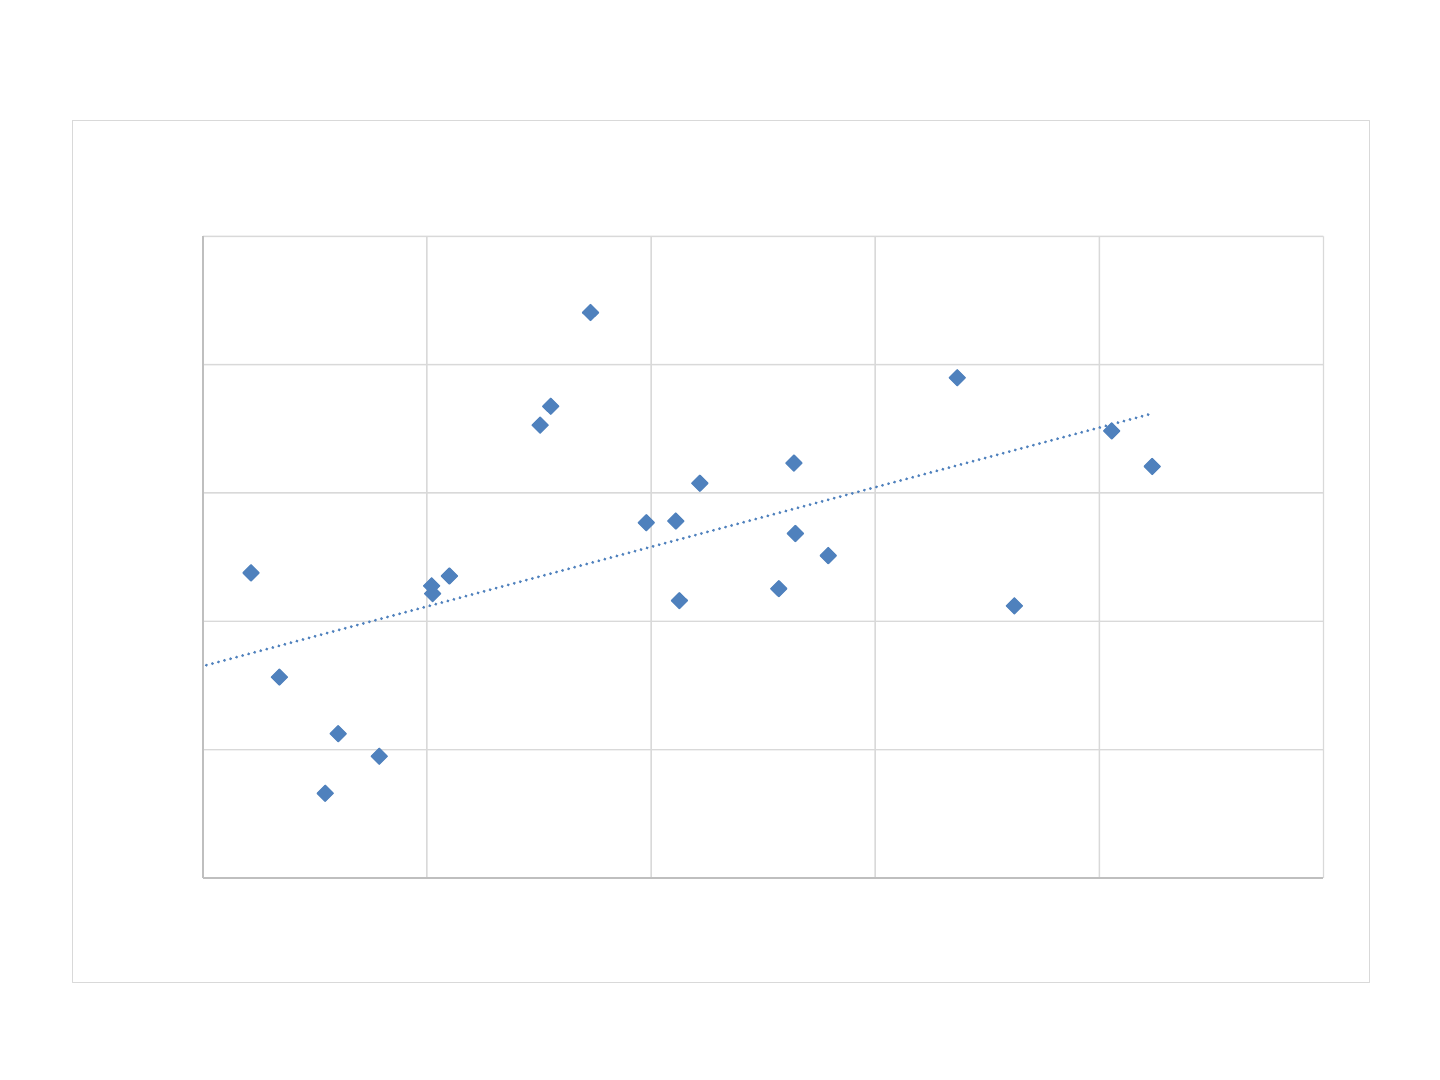
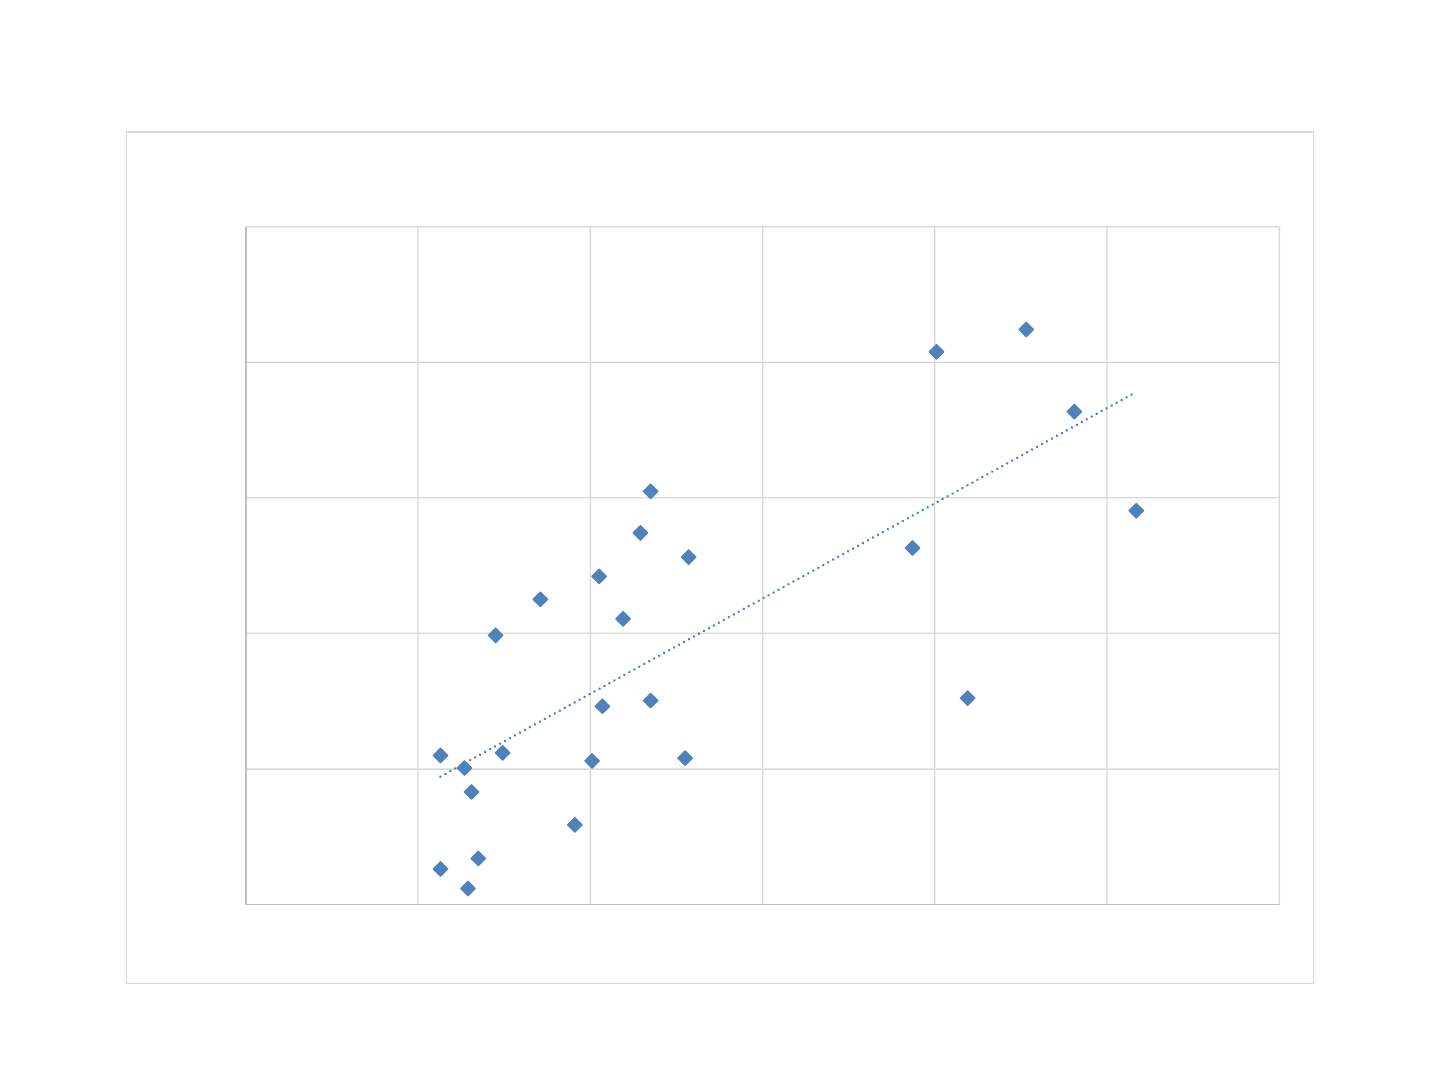
Transactionpricecapratesseemtoreflectinvestorawarenessof
differencesinrealdepreciationratesacrossmetros
Slopeofregressionlineis0.47(t‐stat=3.5,R
2
=35%).Realdepreciationaloneapparentlycan
explainanimportantamountofthedifferenceincapratesacrossmetros.
Atlanta
Austin
Baltimore
Boston
Charlotte
Chicago
DC_Metro
Dallas
Denver
Detroit
Houston
Minneapolis
NYC_Metro
Philly_Metro
Phoenix
Pittsburgh
Portland
SF_Metro
Sacramento
San_Diego
Seattle
So_Fla
St_Louis
6.0%
6.5%
7.0%
7.5%
8.0%
8.5%
0.5% 1.0% 1.5% 2.0% 2.5% 3.0%
AvgTransactionCapRate(2001‐13)
DepreciationRate/Yr%PropertyValue
CapRatesRelatedtoAvgDepreciationRateByMetro
Correlation=+59%
Andavg realdepreciationratesreflectthedifferencesinsupply
elasticityfordevelopment inspacemarketacrossmetros
DirectionofCausalityis:Supplyelasticity Depreciationrates CapRates
NYC_Metro
DC_Metro
LA_Metro
SF_Metro
Chicago
Boston
Houston
Seattle
Dallas
Atlanta
Miami
San_Diego
San_Jose
Denver
Phoenix
Philly_Metro
Austin
Minneapolis
Portland
Tampa
Orlando
Charlotte
Baltimore
St_Louis
Detroit
0.5%
1.0%
1.5%
2.0%
2.5%
3.0%
0.0 0.5 1.0 1.5 2.0 2.5 3.0
AvgDepreciationRate/Yr%PropertyValue
Metro(CBSA)DvlptSupplyElasticityIndex(SaizMeasure)
DepreciationRatesRelatedtoDevlptSupplyElasticityByMetro
Correlation=+75%
Regressionlinehasadj R
2
=56%,t‐stat5.4.
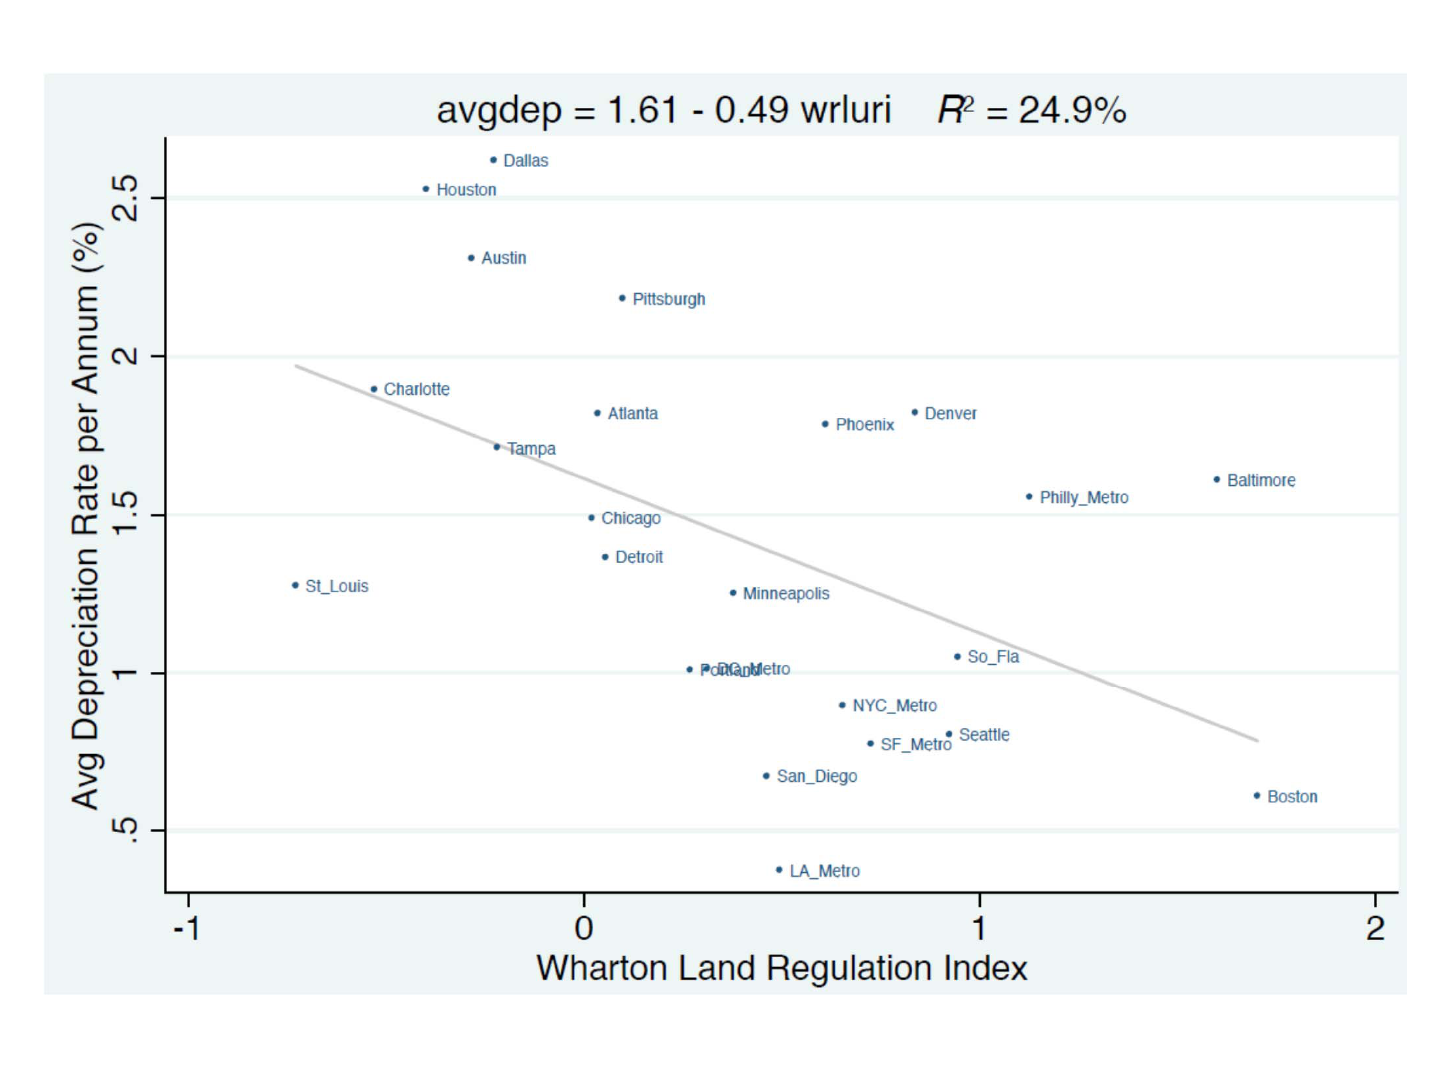
Regulatoryconstraintsreducedepreciationsomewhat,but…
Greaterregulation lowerdepreciation.
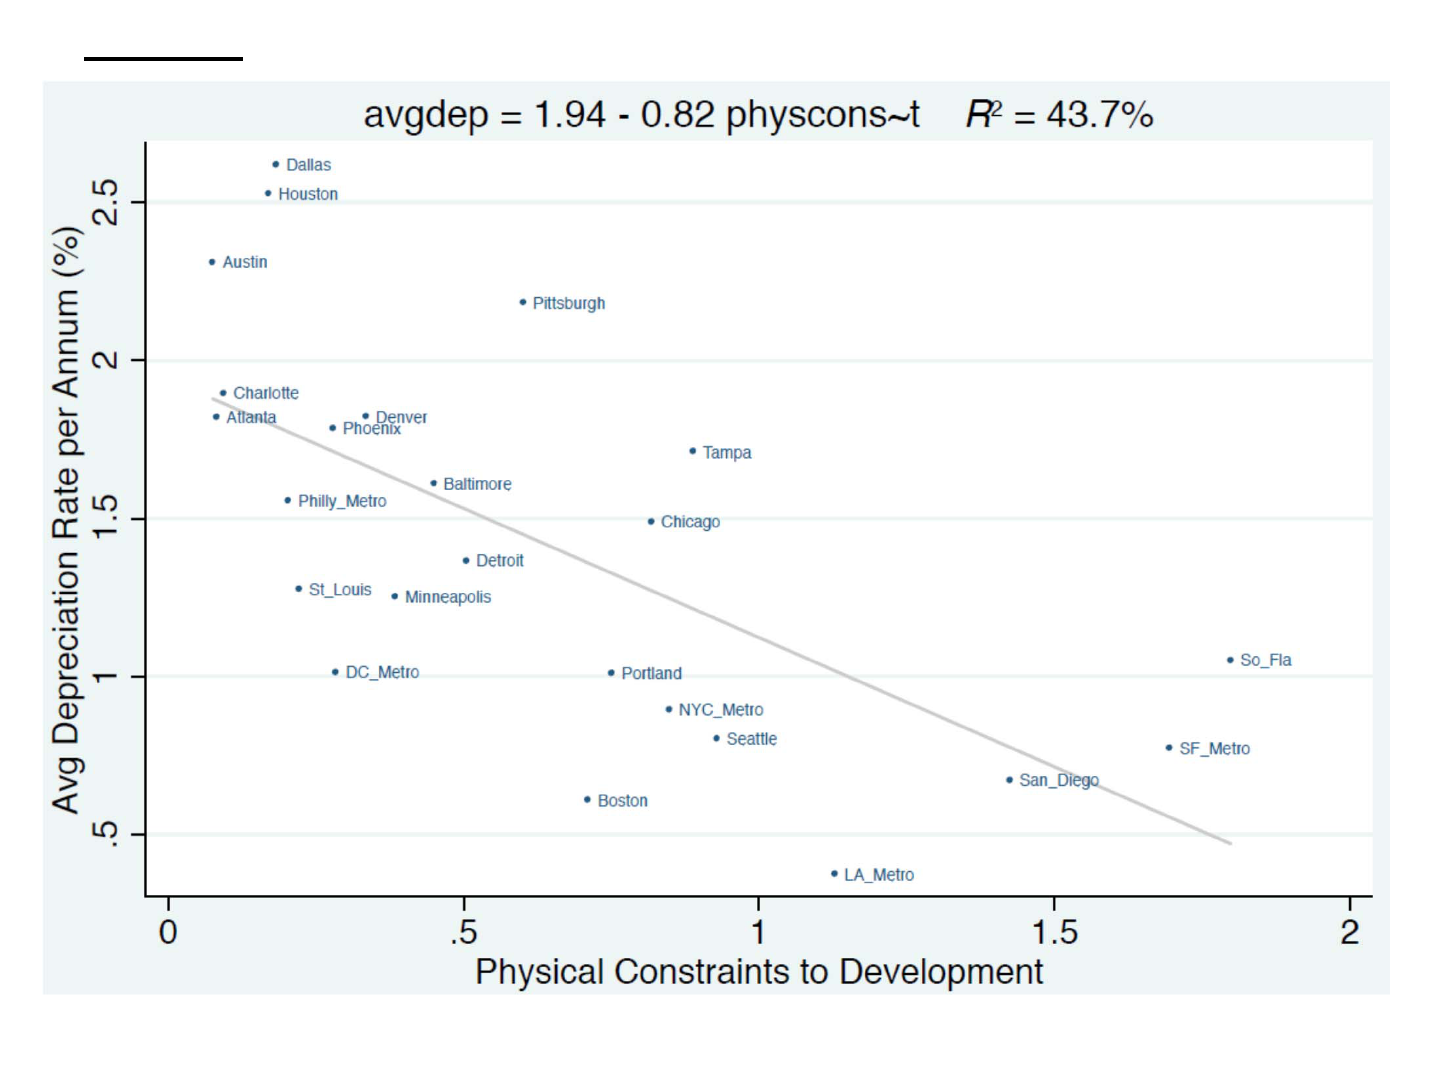
Physical landsupply constraintsreducedepreciationevenmore…
LandConstraint SupplyConstraint+Highlandvaluefraction Low erdepr 2ways
0
0.2
0.4
0.6
0.8
1
1.2
0 1020304050
RatiotoNewlyBuiltPropertyValue
StructureAge(yrs)
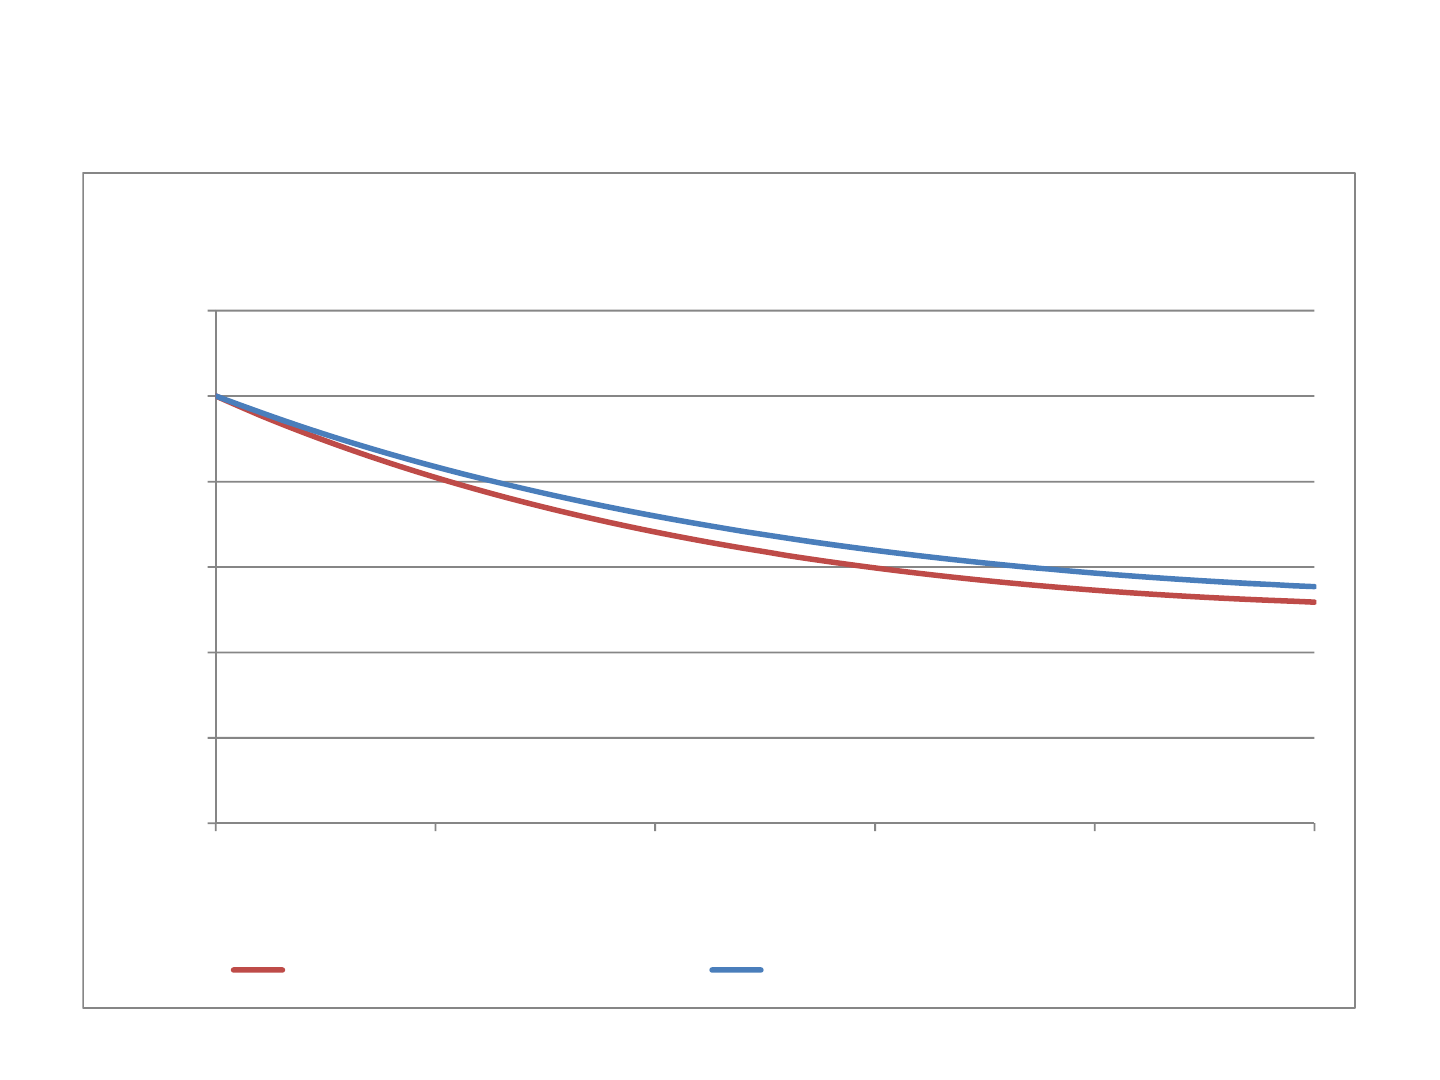
DepreciationinTypicalvsBubblePeriod(2005‐2007)
(CumulativeEffectofRealDepreciationonPropertyValueincludingland)
TotalDepreciation‐TypicalPeriod Total Depreciation‐BubblePeriod('05‐'07)
EffectofPropertyAssetMarketConditionsonDepreciation:
Duringthe“bubble”period(2005‐07)depreciationwasonlyslightly(though
statisticallysignificantly)lowerthanduringother years:1.2% vs 1.3%/yr.

Conclusions&FuturePlans…
• RealdepreciationinCRE averagesaround1.3%/yr,withinterestingdifferences
acrossmetroareas.
• Depreciationisfasterin“younger”properties(newerbuildings),largely(but
notentirely)reflectingthelargershareofthestructurevalue(ofnewer
buildings)inthetotalpropertyvalue(smallerlandvaluefraction).
• Iflandvalueaverages20%
of(newly‐deve loped)propertyvaluethenreal
depreciationofthestructurealone averagesabout1.9%/yr,rangingfromover
2.7%fornewbuildingstounder0.6%for50‐yr‐oldbuildings.
• Apartmentpropertiesdepreciateonlyveryslightlymorethannon‐resi
commercialproperties(1.7%vs 1.3%/yr),notenoughtojustifytheIRSpolicy
differential(although,IRSdepreciationrulesalso ignoreinflationwhich
rendersdepreciationexpensededuction“recapture ”ubiquitousanyway).
• Metroswithlesssupplyelasticity(pertheSaizmeasure)showsignificantly
lowerdepreciationrates(probablyreflectinggreaterlandvaluecomponent).
• Physicallandconstr aintshavebiggerimpactondepreciationthanregulations
• Assettransactioncapratesare
positivelycorrelatedwith,andareimportantly
explainedbythedifferenceindepreciationratesacrossmetros.
• Depreciationcontinuedtoexistduringthe“bubble”years(2005‐07),butata
slightlyreducedrate(1.2%vs 1.3%/yr,statisticallysignificantdifference).
